Managing Traffic Sensors
![]() Filteting Out the Local Network Traffic
Filteting Out the Local Network Traffic
![]() Configuring Conditions and Alerts
Configuring Conditions and Alerts
![]() Editing Sensor Name and Description
Editing Sensor Name and Description
To add a Bandwidth Monitoring sensor you need to:
1. Select a host on the host list. Open the context menu and select the Add Sensor item.
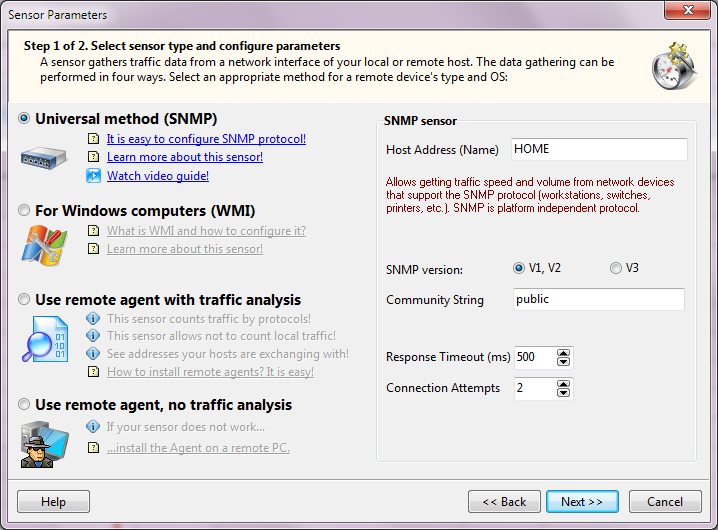
2. The Sensor Parameters Wizard window will appear:
On the first page (after the welcome page), select the Sensor Type and configure its parameters.
After configuring the parameters, click Next >>.
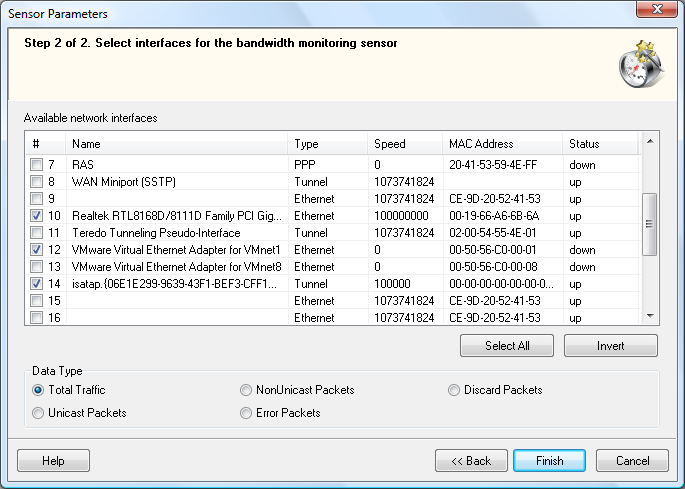
3. Using the configuration from the previous step, the Wizard searches the host for available network interfaces and displays them. Select the interfaces to add into the program as sensors for monitoring.
In the Data Type field, you can select the type of the information the sensor should collect. This can be:
- Total Traffic - the number of bytes sent and received trough the interface.
- Unicast Packets - the number of unicast packets sent and received trough the interface.
- NonUnicast Packets - the number of nonunicast packets sent and received trough the interface.
- Error Packets - the number of error packets sent and received trough the interface.
- Discard Packets - the number of discarded packets sent and received trough the interface.
If you select several interfaces, the appropriate number of sensors will be created. Each sensor takes account of the traffic on only one interface.
Click Finish to finish adding the sensors. The new sensors with the specified parameters will be added to the Monitoring list.
To edit a sensor options you need to:
1. Select a sensor node in the monitoring list.
2. Open the context menu and select the Edit Sensor item.
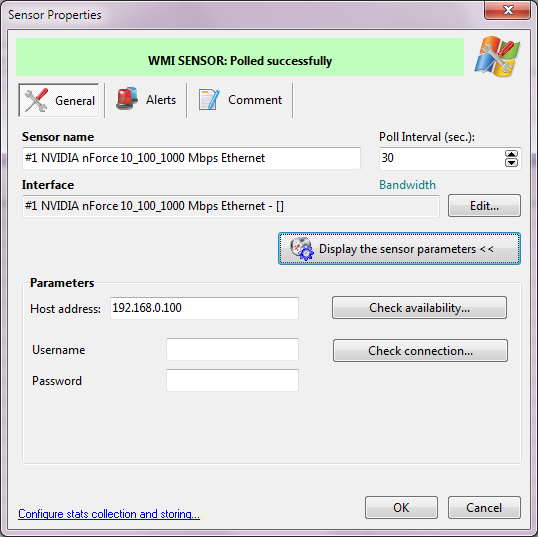
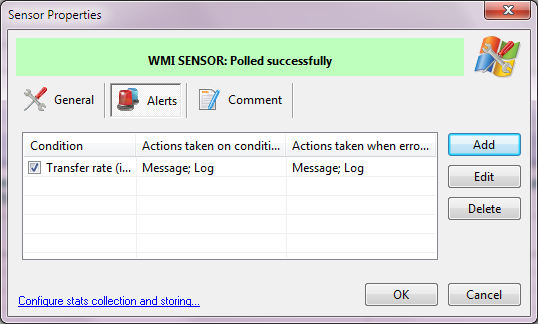
3. This will open the Sensor Properties window.
4. You can edit the following properties on the General tab:
- Sensor name - a name of the sensor that will be displayed on the host tree.
- Parameters - the sensor's settings. Every type of a sensor has its own set of parameters (Host address, TCP port, Password, etc.)
- Interface - you can change the network interface the sensor is assigned to. When you click the Edit... button, the Sensor Parameters Wizard window will appear. Click the Next>> button to move to the page containing the list of available network interfaces. If the interface listing error appears, you should close the Wizard and change the sensor Parameters to the correct values (Host address, TCP port, Password, etc.)
- Poll Interval - the period of time the program should wait between two repeated sensor polls (in seconds). If you set short values (less than 5 seconds), the CPU load will increase. If you configure a long interval (more than 2 minutes), the bandwidth speed detection accuracy can suffer. The optimal value is 30-60 seconds.
5. On the Alerts tab, you can configure conditions for raising alerts and sending notifications. You can learn more on the conditions configuration below: Configuring Conditions and Alerts
6. On the Comments tab, you can write an arbitrary comment for the sensor. This comment can be automatically inserted into the alert notification massage (when using the special key in the message text).
7. Click OK to save all the changes.
All changes are saved automatically and take effect immediately.
![]() Filtering Out the Local Network Traffic
Filtering Out the Local Network Traffic
The program can filter out and not count your local network's traffic. To do this, you need to use the "Sniffing packets" sensor only and to enable the local network traffic filter. This can be done in two ways:
1. When you create a "Sniffing packets" sensor, click the "Do not count local traffic..." button on the last step of the Sensor Parameters Wizard window.
2. Select a sensor with the "Sniffing packets" type in the list and select "Edit Sensor" in the context menu. Click the "Do not count local traffic..." button.
You will see the following dialog window:
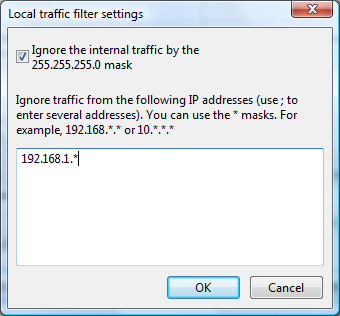
Select the "Ignore the internal traffic by mask" option and configure IP addresses and IP address masks (use *) which should be ignored when the program counts traffic.
![]() Configuring Conditions and Alerts
Configuring Conditions and Alerts
You can configure the execution of some actions under particular conditions. These can be:
- Bandwidth speed exceeding over a certain limit or dropping below a certain limit on the sensor's network interface.
- Traffic volume sent and/or received through the interface exceeding over a certain limit.
- Errors on the network interface during its operation exceeding a limit.
To configure conditions and alerts:
1. Select a sensor node on the Monitoring list.
2. Open the context menu and select the Configure Alert item.
3. In the Sensor Properties window that appears, click the Alerts tab. Then click Add.
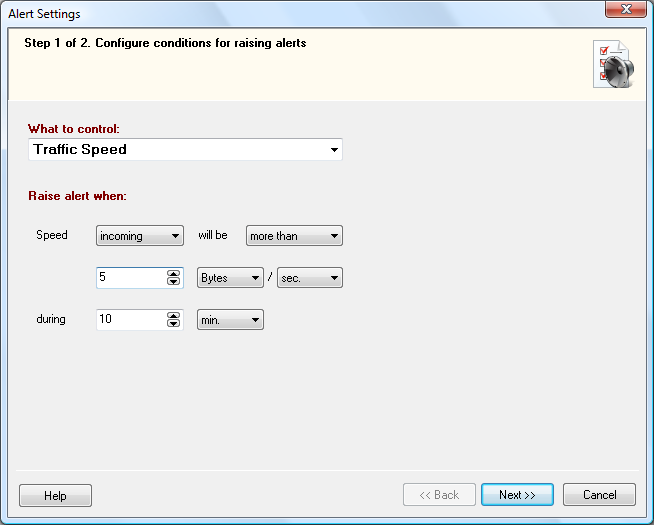
4. On the first step, you need to Configure conditions for raising alerts. These may be:
- If the incoming or outcoming bandwidth speed is be more than/ less than/ equal/ unequal to the threshold value in configured period of time. For example, if the traffic speed is less than 100 kb/sec during the last 10 minutes of the sensor polling, the alert will raise and a notification will be displayed or sent.
- If the incoming or outcoming traffic volume during the specified period of time will be more than/ less than / equal/ unequal to the threshold value. For example, if the monthly downloaded volume of information volume is more than 20 GB, a notification will be sent. In this case, all the gathered polling results for the period are analyzed including the monitoring service restarts (reboots, etc.). Please keep in mind, that the accuracy of traffic volume tracking during the long period of time strongly depends on how long the monitoring service operates. The traffic statistics are not collected when the bandwidth monitoring service is not started.
- If the configured number of polling errors occurred. This alert condition allows you detecting errors in the network interface operation so you will be informed about them in time. If an error is detected, the error description will be recorded to a log or sent via email. However, not all errors can occur as a result of the interface failure. This can be a bug or a connection failure to the SNMP agent, WMI, or the remote agent. The last message from the sensor allows you to find out the reason of the failed polling. You can find this message in the "Status" column on the "Table" tab when you select the sensor on the sensor tree.
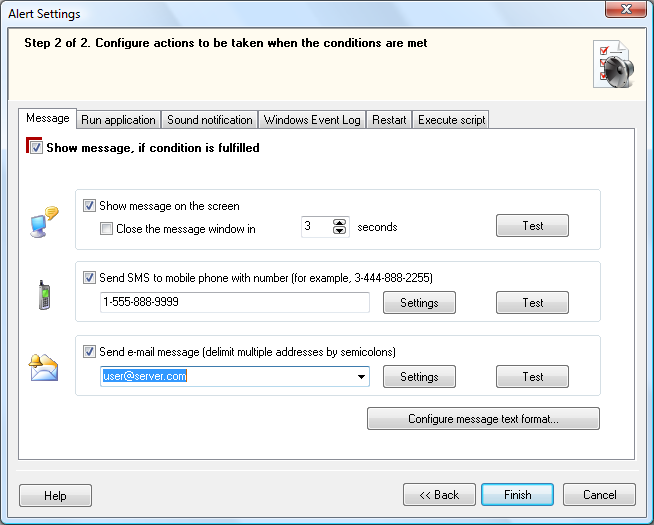
5. On the second step, you need to Configure actions to be taken when the conditions are met. There are "Red" and "Green" alerts. For the Traffic Volume and Bandwidth Speed conditions, only the "Red" alert is available. These actions will be taken when the configured conditions are met.
For the Polling Errors, there are the "Red" and "Green" alerts available. The "Red" alert will be taken when the polling errors are detected. The "Green" alert will be taken when the errors are recovered. Thus, administrator can be informed about the interface operation failures and the interface recovery after the failures as well.
The program allows you to configure the following actions:
- Message
The program generates a message. You can configure the message text and how the message should be displayed or sent:
- Show the message on the local computer screen. You can specify the time duration for displaying the message window.
- Send SMS. The program sends an SMS message to your mobile phone. You should specify the mobile phone number in this pattern <country code><phone number> (for example: 19021235566). The program sends SMS messages by sending e-mail messages to your cellular operator's SMS gateway. A majority of GSM operators have special e-mail addresses (something like your-number@your-provider.com) which accept messages and deliver them to your cell phone via SMS (Usually they deliver e-mail's subject only). You must enable this feature at your operator and find out the server's address and the message format (the number should be in the message body or the text in the message body, etc.). Get this information from your operator's customer service. After that, you must configure the SMS gateway address and SMTP server connection parameters in the program settings.
- Send e-mail. The program sends e-mail messages to the addresses that you specify. SMTP server settings for outgoing messages can be configured in the program settings. If you want to send e-mail messages to several recipients, please separate their addresses by a semi-colon.
- Run Application
The program launches an external application with parameters (if necessary).
- Sound Alarm
The program plays a specified audio file (WAV).
- Record to Log
The program records a text message (configure the text in the program settings) to:
- The program log file. You can configure the log file's name and path in the Alert section of the program settings (by default, it is the BMAlerts.log file stored in the application data folder in the user profile: <disk>:\Documents and Settings (or Users)\All Users\Application Data\10-Strike\Bandwidth Monitor\Logs\). You can also view the existing log file here by clicking the View Log File... button.
- Windows Event Log. Select a record type (these can be: notification, warning, error). Click the View Event Log... button to view the Event Log.
- Restart (Computer/Service)
The program starts/stops/restarts specific service on the computer being checked, also the rebooting/shutting down/turning on of the computer. To configure the service action, select the Service option, click the '<<' button, and then select the required service from the list. You can also restart or shutdown the monitored computer. To configure the computer restart/shutdown action, select the Computer option and select an action to do (shutdown, restart, power up). If a current user does not have administrator rights on the remote computer, you will need to provide the remote administrator name and password in order to execute the service operations or shutdown the computer successfully. To do this, please select the Authorization required option and fill in the Username and Password fields.
- Execute the Script
The program allows you to execute VB Script and JavaScript. Create the script code in any text editor and click the Load button to load it. Define the main functions' name of the script in the appropriate field. Click Test button to test the scripts' operation.Once you have configured all the required properties, you can test the alarm performance by clicking the Test button. Click the Finish button. The new alarm conditions with the specified parameters and actions will be added to the list of this sensor. To save the list of condition press OK on the Alert settings window.
To delete a sensor:
1. Select the sensor node in the Monitoring list.
2. Open the context menu and then select the Delete Sensor item.
The selected sensor will be deleted from the monitoring list.
To temporarily disable a sensor without deleting it:
1. Select the active sensor on the Monitoring list.
2. Open the context menu and then select the Disable Sensor item.
Disabled sensors are marked with a gray icon.
To enable a disabled check:
1. Select the disabled sensor on the Monitoring list.
2. Open the context menu and then select the Enable Sensor item.
Enabled sensors are highlighted with its original color: red or green (corresponding to its state).
The polling interval editing is described here.
![]() Editing Sensor Name and Description
Editing Sensor Name and Description
When you add a new sensor its name will be assigned to the network interface name by default. It can be too long or complicated. You can edit the sensor name and configure its description. These parameters can be used in alert messages by using the corresponding keys (%S and %DSC).
The sensor name and description editing is described here.
To force a sensor polling without waiting for its turn in the monitoring queue:
1. Select the sensor on the list.
2. Open the context menu and then select the Force poll item.
The sensor will be polled immediately and the result displayed on the screen.