The Application Structure
10-Strike Network Monitor consists of several parts:
- Monitoring Service is a Windows service that is the main engine for polling network devices, signaling, logging, and collecting statistics.
- Graphics Console is a desktop application that allows you to manage the Monitoring Database, add new hosts, add new checks, view the hosts' status, edit any settings of the Monitoring Application, view graphs, and generate reports.
- Database is a single Firebird database for keeping the Monitoring Application's data: host parameters, checks, statistics, and logs.
- Remote Agent is a Windows service that can be installed on a computer to collect the data that cannot be obtained remotely over the network by using the standard network protocols.
- Web Interface is a Java application that runs on the Jetty web server and provides access via a web browser. It replicates almost all features available when using the Graphics Console. You can deploy the Web Interface separately on any platform that supports Jetty and Java.
- Browser Agent is an application that allows you to launch executable files from the web interface.
- Watchdog is a Windows service that ensures the continuous operation of the monitoring server and restarts it in case of failures.
- Provider is an application in which you can connect to monitoring databases installed at different locations and monitor their parameters, quickly open a console with the monitoring data loaded into it.
Installing the Application
For the application to work, you need to install at least these three components: the Monitoring Service, the Database, and the Graphics Console.
You can host the Database on any server. Just make sure that the Monitoring Service and the Graphics Console can connect to the Database. You can deploy the Monitoring Service and the Database on the server, and install the Graphics Console on your working computer. Then you can connect from your computer to the server to configure the monitoring and view the results.
You can host the Jetty web server and the Web Interface (Java application) on any server. Just make sure that the Java application can connect to the database through TCP port 3050. For the Jetty web server to work, you need to use JRE version 11 or higher.
Firebird, Java, and Jetty can be deployed on different platforms. As you can see, 10-Strike Network Monitor is a nearly cross-platform monitoring system. The only exception is the Monitoring Service, which runs on Windows.
How Does It Work?
The Monitoring Application works by polling hosts added to the Monitoring Database. It polls each of them by running the predefined host monitoring checks one by one. Each check gets a status based on its result (passed or failed). The results are written to the Database.
- You can add hosts and checks to the database by using the Graphics Console or the Web Interface.
- The Monitoring Service will get the data that you have entered and start polling the hosts on a regular basis, updating their status in the Database, gathering statistics on the date-and-time of the polls and the values of the monitored parameters (voltage, memory, CPU load, etc.).
- The Graphics Console will get the polls' status and display it as a colored list. It will also plot graphs and generate reports based on the collected statistics.
- In case of a failure, the Monitoring Service will initiate some of the following actions: logging an appropriate entry (both to the Database and to the local file), sending an SMS (text message), sending an e-mail, restarting or stopping the services or the computer, displaying an appropriate message on the screen, playing back the specified sound file, launching external programs or commands with parameters, etc. The Monitoring Service will delegate the last three actions to the Graphics Console, which must be running to do its part of the job.
- When polling the hosts, the Monitoring Service uses many standard protocols: SNMP, TCP, ICMP, ARP, HTTP, FTP, WMI, and NetBIOS. If it cannot get remotely some data (for example, CPU load or hard drives' S.M.A.R.T. parameters), the Remote Agent will come to help. The Remote Agent that runs as a service on a remote host will collect the necessary data locally and send it to the Monitoring Service when requested.
- The Web Interface replicates almost all features available when using the Graphics Console. You can connect to the Monitoring Application's web server from any mobile device, laptop, or desktop computer to check the polls' status or the logs, plot some graphs, or change some parameters.
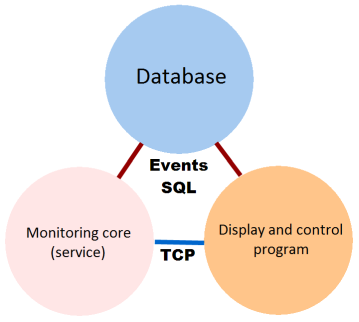
The Graphics Console and the Monitoring Service always keep in touch with each other. For reliability reasons, they communicate using two different methods. If it is impossible to establish a direct TCP connection (through port 58698) between the Graphics Console and the Monitoring Service, they will communicate indirectly, via the Database. This way, the Monitoring Service will immediately learn about any changes in the Monitoring Database (changed check parameters, added new checks, etc.). And vice versa, any polling results will be immediately sent from the Monitoring Service to the Graphics Console. If the direct TCP connection is suddenly lost, the Monitoring Application's components will automatically start using the Database to exchange data.
Distributed Monitoring
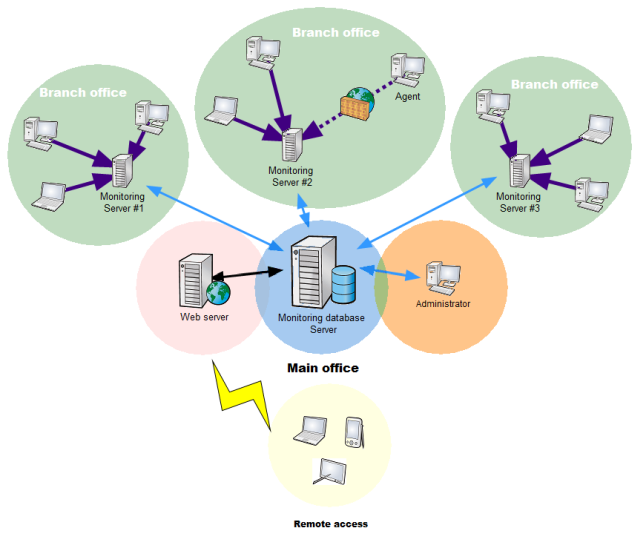
The 10-Strike Network Monitor Pro application supports distributed monitoring. It means that you can install as many Monitoring Services (servers) as you like on different hosts, and each Monitoring Service can use a different set of checks. This way, you can dramatically reduce the load on the Monitoring Server and make the system much more reliable. Even if one server fails, the others will continue running like nothing happened.
In addition to reliability enhancement, distributed monitoring allows you to do centralized checks of multiple remote networks and collect all statistics in one database. You only need to install the Monitoring Service on each remote network server and configure the database connection for that server (using two TCP ports, 3050 and 3051).
Fault tolerance
Smooth operation of the monitoring program is ensured by several factors:
- You can use a backup database server, to which the monitoring server and console will switch automatically if the main database server becomes unavailable. The address of the backup server is set in the database connection settings. You should independently configure the database replication (or the file system mirroring, as an option) to maintain the current state of the backup copy.
- The program will automatically switch the monitoring server to the local database in case of loss of connection with the main one, if a backup monitoring server is not specified. The monitoring server will write the host polling statistics to the local database until the communication with the main database is restored. After the connection is restored, all the data accumulated during this time in the local database is automatically transferred to the main database. No operator actions are required in this scheme. Everything will be done automatically.
- The monitoring server watchdog (the 10-Strike Network Monitor Watchdog service) monitors the parameters of the 10-Strike Network Monitor Pro Service and the Firebird Server service. If the monitoring process freezes, it will automatically restart both services, restoring the operation of the monitoring system.
- Windows automatically starts the monitoring server service if it suddenly stops working abnormally.
You can learn more about the reliability of the monitoring system in the Fail safe monitoring topic.
* The diagram in this section was created using the 10-Strike Network Diagram, our network diagrammer application.