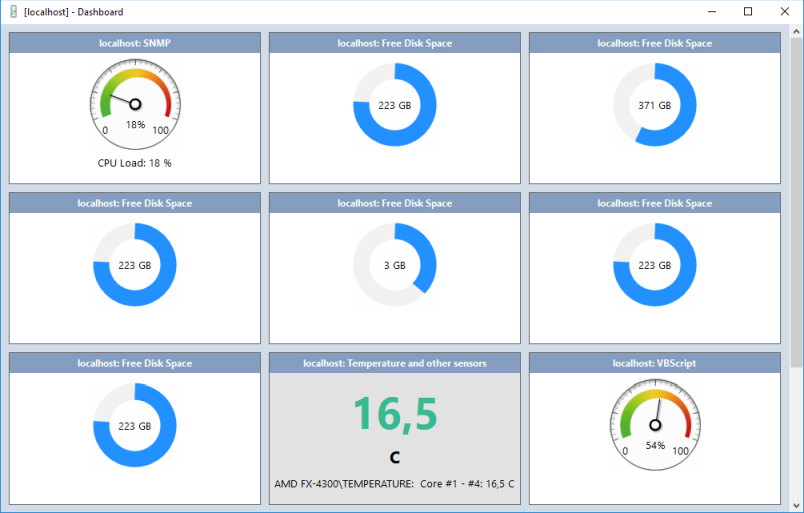
You can display the most important parameters on a visual dashboard in a graphic form of widgets (indicators, gauges, and diagrams) so everybody could watch them. All widgets are displayed on the special pane called the dashboard. You can configure your system so the dashboard will be displayed on a separate big monitor. Every widget can only display one parameter. Widgets are created automatically so every check getting a numerical value is represented by a separate widget.
![]() To display the dashboard pane, select a host in the Host Tree, bring-up the context menu, and select Display indicators.
To display the dashboard pane, select a host in the Host Tree, bring-up the context menu, and select Display indicators.
![]() A separate window with widgets is created for each host. Widgets are only created for checks that have a monitored numeric parameter. Thus, the number of available widgets might not be equal to the number of available checks for a host.
A separate window with widgets is created for each host. Widgets are only created for checks that have a monitored numeric parameter. Thus, the number of available widgets might not be equal to the number of available checks for a host.
![]() The program supports several types of widgets depending from the parameter type and specified measure units in a check. The widget type is usually selected automatically by the program upon the monitoring check creation.
The program supports several types of widgets depending from the parameter type and specified measure units in a check. The widget type is usually selected automatically by the program upon the monitoring check creation.
The following types of widgets are available:
Gauge
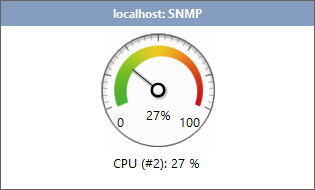
It is used for displaying parameters changing from 0 to 100 per cent. For example, This can be the per cent of the CPU load.
In order to display a parameter on a widget of this type, you need to specify the minimum and the maximum values for possible range of the parameter's values (see the Displaying units on charts topic). Set the min and max range values to 0 and 100.
Circle diagram
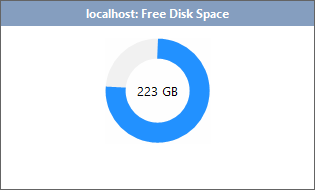
It is used for displaying only free or used disk space in various checks. Specify the minimum and the maximum values for possible range of the parameter's values (see the Displaying units on charts topic). Set the min and max range values to the minimum and maximum disk size.
Bar diagram
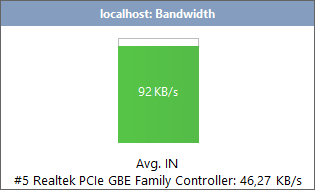
It is used for displaying only the bandwidth on network interfaces. Specify the minimum and the maximum values for possible range of the parameter's values (see the Displaying units on charts topic). Set the min and max range values to 0 and the total capacity value on this interface.
Number indicator
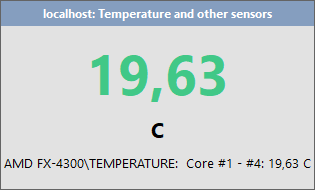
This universal indicator can be used for all other types of parameters which cannot be configured for using with the previous 3 types of widgets. This indicator does not require specifying the mix-max values of the parameter. But if you do this, the color of digits will change smoothly from blue to red going through green and yellow colors in the middle. This indicator perfectly suits for displaying temperatures. Specify the minimum and the maximum values of the temperature range and blue color will mean "cold" and red color - "overheating" (see the Displaying units on charts topic).
Chart
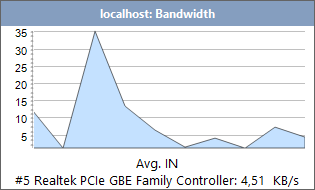
The program can display how a monitored parameter was changing in time with help of charts. The value axis is scaled automatically. This charts displays the data for the last hour.
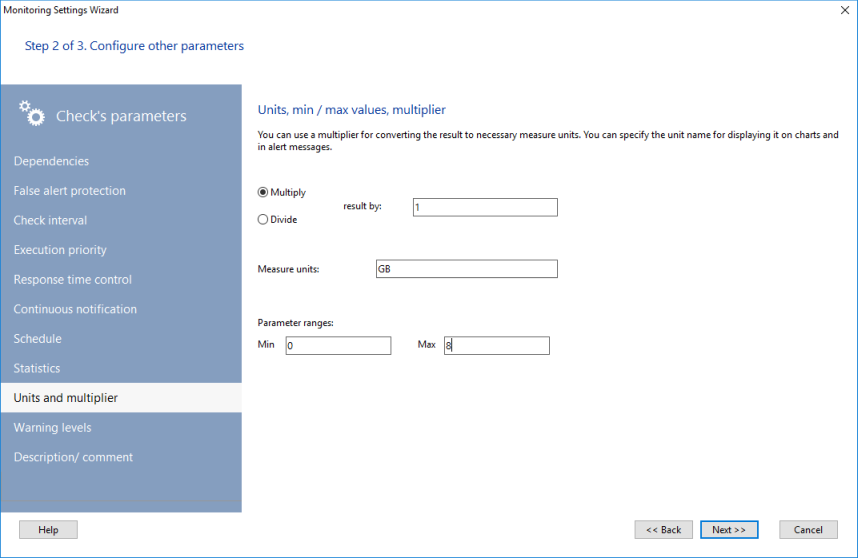
![]() If you want to display measure units on widgets, you will need to specify them in the Measure units field on the Check Parameterswindow (Step 2, the Units and Multiplier page). This window can also be displayed using the indicator's context menu.
If you want to display measure units on widgets, you will need to specify them in the Measure units field on the Check Parameterswindow (Step 2, the Units and Multiplier page). This window can also be displayed using the indicator's context menu.
![]() If you want to see how the monitored parameter changed in time, you can display the chart window using the indicator's context menu (click the right mouse button on it).
If you want to see how the monitored parameter changed in time, you can display the chart window using the indicator's context menu (click the right mouse button on it).
![]() The parameter title under the widget can be specified in the check description on the Check Parameterswindow (Step 2, the Description page).
The parameter title under the widget can be specified in the check description on the Check Parameterswindow (Step 2, the Description page).
![]() Widgets are refreshed once per second. But keep in mind that they take values from the corresponding monitoring checks and they can have their own timing between updates (see the Check interval topic).
Widgets are refreshed once per second. But keep in mind that they take values from the corresponding monitoring checks and they can have their own timing between updates (see the Check interval topic).
![]() You can move and place widgets as you want on the pane. The grid is used to simplify the widget alignment.
You can move and place widgets as you want on the pane. The grid is used to simplify the widget alignment.
Displaying Widgets on Map
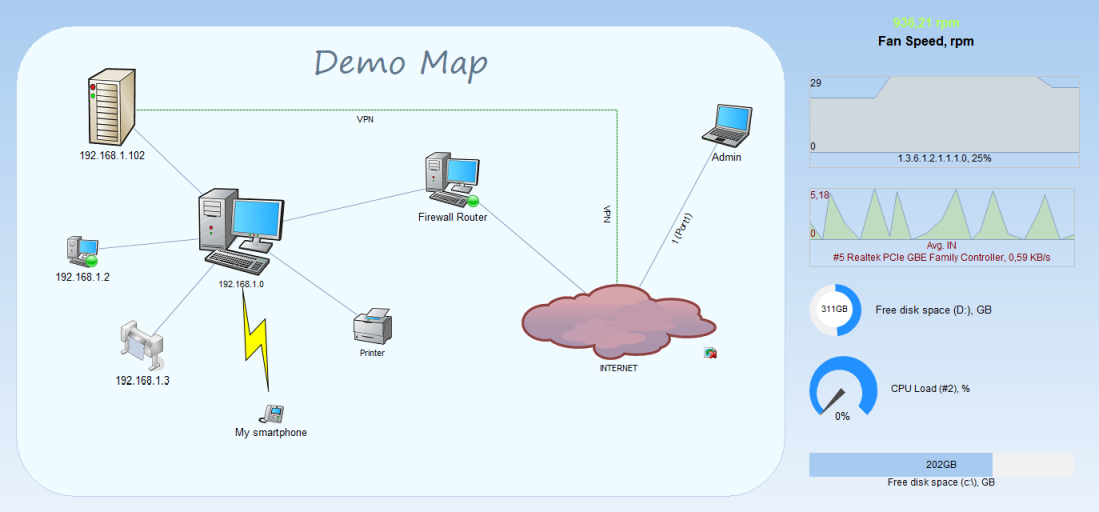
![]() The widgets described above can also be displayed right on the network map near device icons, not only on the dashboard pane's separate window. This can be helpful for displaying various critical parameters on a common map displayed on a large screen. The map widgets are based on the same set of parameters as the dashboard window widgets. The widget type (chart, diagram, or gauge) depends on the monitoring check parameters set in the Display Chart settings (the Widget type parameter).
The widgets described above can also be displayed right on the network map near device icons, not only on the dashboard pane's separate window. This can be helpful for displaying various critical parameters on a common map displayed on a large screen. The map widgets are based on the same set of parameters as the dashboard window widgets. The widget type (chart, diagram, or gauge) depends on the monitoring check parameters set in the Display Chart settings (the Widget type parameter).
Specify the minimum and maximum parameter values for its correct displaying (if it was not set before). You can do this in the same section of the monitoring check settings (Display Chart).
![]() You can add a widget to the map as easy as you can add a line or area:
You can add a widget to the map as easy as you can add a line or area:
- On the map window's main menu, click Draw and select Add Indicator.
- Select a check which parameter you would like to display on a map widget from the list of checks, and click ??.
If all necessary parameters have been already specified for that check, the widget will be added and display the actual data in several seconds.
![]() You can move widgets across the map like icons and resize them like areas. You can hide/display widgets depending of the check result.
You can move widgets across the map like icons and resize them like areas. You can hide/display widgets depending of the check result.
![]() The chart and text color for all types of widgets can be configured using the widget area's graphic properties (use the context menu).
The chart and text color for all types of widgets can be configured using the widget area's graphic properties (use the context menu).