![]() Protection against false alerts
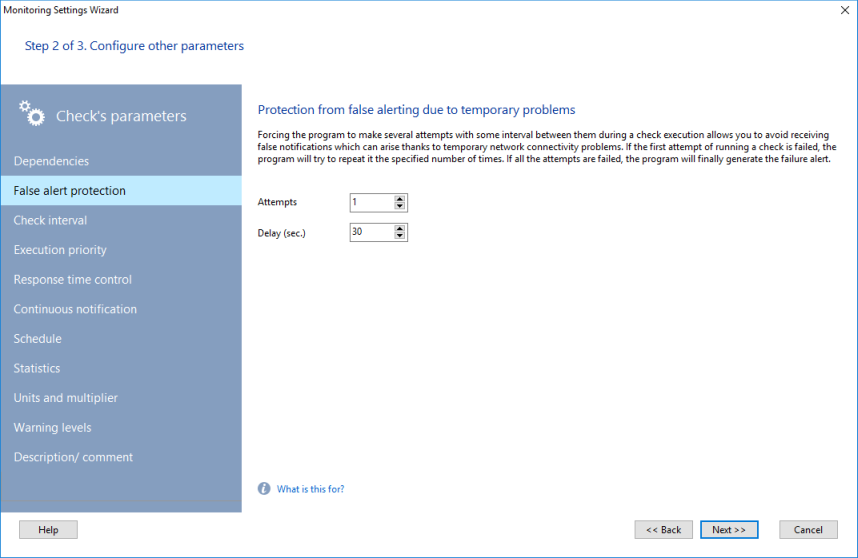
Protection against false alerts
![]() Check execution priority (Running order)
Check execution priority (Running order)
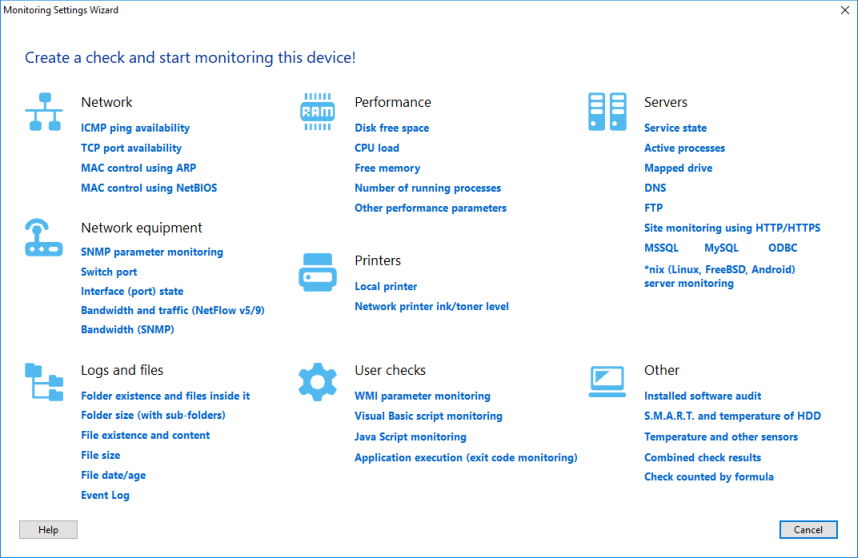
To add a monitoring check to a host:
1. Select a host in the list of hosts. In the list of checks, open the context menu and select the Add Check item.
2. The Monitoring Settings Wizard window will be displayed. Select the check type on the window.
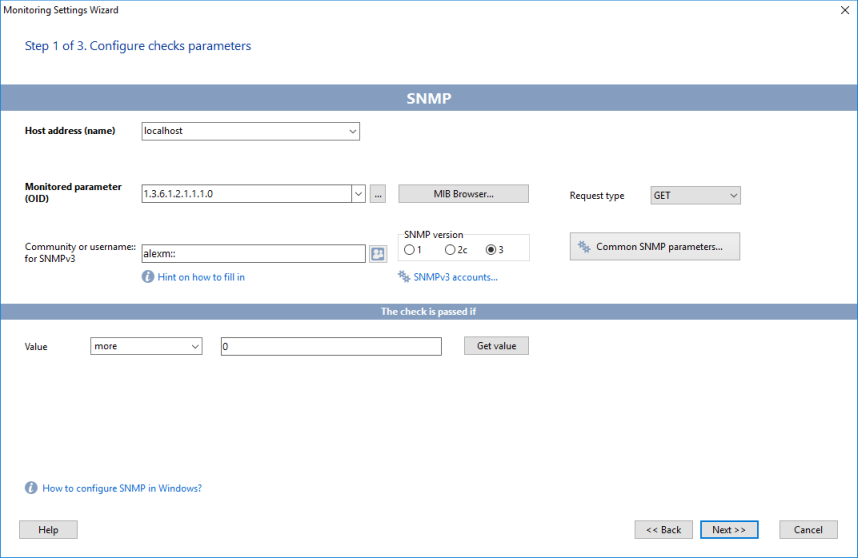
3. Configure the new check's parameters and specify conditions for considering the check result as passed or failed. Please always note the check's logic displayed on the screen: The check is passed if...
Check whether the program can receive the monitored parameter over the network using the provided data (use the Test or Get value buttons). Click Next.
4. On the Step 2 of the Wizard, you can configure additional logic for the check (see more details on the dependent checks below).
Click Next.
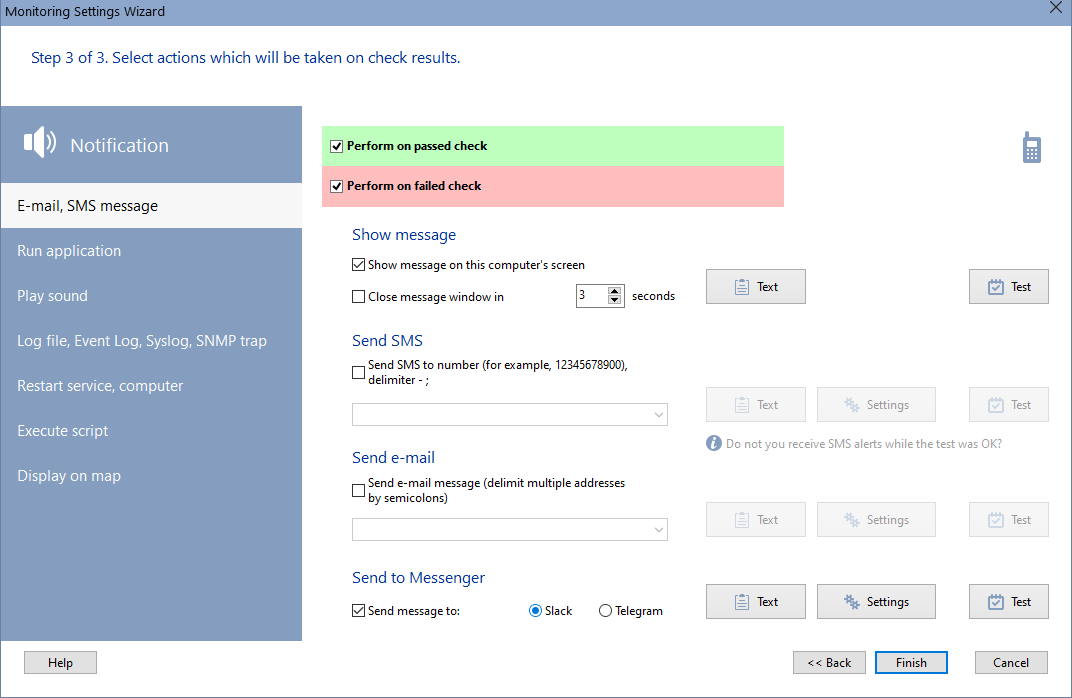
5. On the last Step 3, you will see the notification settings of the check.
These actions will be executed when the check will be passed and/or failed.
The green selection will work when the check is considered as passed (for example, a recovery after a failure). The red selection will work when the check is considered as failed.
The following actions and notifications are supported as a response to the successful and unsuccessful check results:
- Displaying Message
The program generates a message which is displayed on the screen, or sent via e-mail or SMS. You can configure the message text.
- Screen: The predefined text message can be shown on the local computer's screen. You can specify time duration for displaying the message window.
- SMS: The program can send SMS messages to your cell phone. You should specify a mobile phone number in this pattern: <country code><phone number> (for example: 19021235566). Learn more about sending SMS.
- E-mail: The program sends e-mail messages to addresses that you specify. The SMTP server settings for sending emails can be specified in the Program Settings.
- Messengers: The program can send alerts to Slack and Telegram messengers. You will need to configure the program for that. Sending to several chats (channels) at once is available if you list them in the field separated by commas.
- Running Application
The program launches an external application with parameters if necessary.- Sound Alarm
The program plays a specified audio file (WAV). Sound notification works in the desktop application and in the web UI in a web browser as well (in the Pro version). For the successful sound file playing in the web mode, please place necessary sound files (if you are using your custom sounds not provided with the program) to the \Program files\10-Strike Network Monitor Pro\web\sounds\ folder. The file path in the alert settings can be any, but the file name should be the same for the successful operation.
- Writing to Log File, Syslog, SNMP Trap, Event Log
The program records a text message (specify it in the program settings) to:
1) the program's log file. You can specify the file name in the program settings, in the Alerts->Log section (by default, it is NMAlerts.log in the all users application data folder C:\Documents and Settings\All Users\Application Data\10-Strike\Network Monitor\Logs\). You can watch the existing log file on the same screen.
2) Windows Event Log. Select a record type (notification, warning, error). You can view the Event Log by clicking the View log file... button.
3) Syslog. You can learn more about this function in the Syslog Monitoring topic.
4) SNMP trap. This function sends an SNMP trap to a specified host on the network. Learn more about SNMP traps here SNMP Trap Monitoring.
- Restart
This option allows you to start/stop/restart a specific service on the computer being checked and reboot/shut down/turn on the computer itself. The actions listed on this tab require administrator rights on remote computers.
To configure the service action, select the Service box, click the ' << ' button, and then select a required service on the list.
If the current user does not have administrator rights on the remote computer, you will need to provide the remote administrator's credentials in order to complete the service and computer operations successfully. To do that, please select the Authorization required box and fill in the Username and Password fields.
The Pro version allows to restart not only a service or a computer specified in the check's address field (the command will be sent by the monitoring service). It can restart a service or a PC using the Agent service that is installed on some remote PC. The Agent can shut down any server accessible from it on a remote network.
For example, if a check with the UPS address throws the "The server has switched to the battery power" alert, you can shut down a server with any other address.
- Executing Script
This option allows you to execute a VBScript, JScript, or bash script. The script code is to be created in an external text editor and to be loaded into this window by clicking the Load button. Or, you can copy the script code to the corresponding field. Specify a name of the main function of the script in the appropriate field. You can execute the script for test purposes by clicking the Test button.
To execute a bash script, you need to place it on a remote machine and specify the full path to it. And also specify the parameters for connecting via SSH: login, password, port, remote host address, timeout, and the private key file if necessary (must be on the same machine as the program).
- Show on map (in Pro)
The program can change color of a line or an area, hide/show any map object depending on the check result. A map with necessary objects should be opened if you want to use this action. All lines and areas will be loaded to a list and displayed in the field where you can select the necessary objects. You can assign a specific color for lines/areas for each state of the check. For example, the host's line on map can be drawn red on the host failure and become green on the recovery. Thus, you can display the state of communication channels visually on your network map.Once you have configured all properties that are required, you can test out the notification alert by clicking the Test button. All the selected notification options will be executed.
Click the Finish button. The new check will be added to the monitoring check list for the host. All the settings will be saved automatically and the check will start working from that moment.
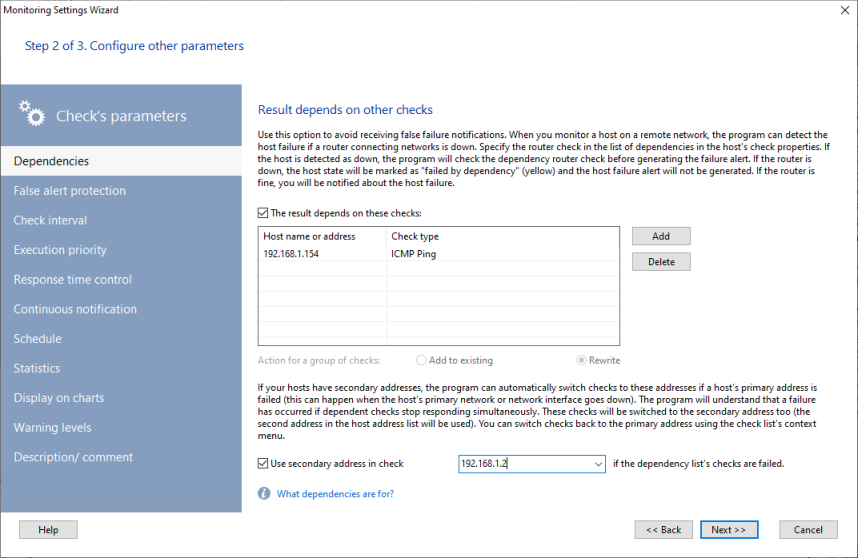
The "dependencies" are checks that define the availability of servers (e.g., ISA Server or Proxy Server) and services (e.g., DNS Server or DNS Client) required by a target computer (i.e., on which a target computer is dependent). The specified dependency check(s) must be successfully executed before the other monitoring checks can be run. E.g., If you access the Internet through a Proxy Server, an ICMP Ping dependency check can be set to check the availability of the Proxy Server, before executing an HTTP monitoring check to avoid false alerting. If the dependency ping check fails, the HTTP check will not be run but will be classified as a "Failed by Dependency" and the device will have the "Unknown" status (instead of getting the failed HTTP check result).
Hint: Use dependencies to avoid receiving a flood of alerts, when servers that provide access to other services being monitored are down (VPN servers, routers, gateways).
If the host has secondary addresses in other networks, the program can automatically switch the checks to these addresses if the host's primary address/network fails. The program will understand that a network failure has occurred if at least one check from the dependency list fails. All the host's checks with dependencies will be switched to the secondary address you can select below. When the checks from the dependency list recover, the program will automatically switch the host checks back to the primary address.
![]() Protection against false alerts
Protection against false alerts
You can also configure the number of check attempts and specify a time interval between them (the Delay setting). If the first check fails, the program will run that check again after the configured interval of time. This helps to avoid receiving false alerts when a temporary network outage occurs. If all the attempts finally fail, you will receive the "failed check" alert.
This is a time interval between two checks following one after another. When you create a new check, the interval time is set to a default value that can be configured in the program settings.
In order to set/change the time interval for one or several checks, please do the following:
1. Select one or several checks on the Check List.
2. Bring-up the context menu and select Edit check interval
3. Specify a new interval value on the Check interval window and click OK.
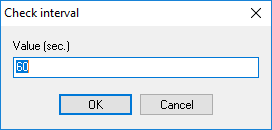
The entered value will be applied to all the selected checks immediately.
Please note, that if you use very short intervals for several CPU loading checks (like WMI, processes, motherboard sensors, custom scripts and external applications, databases, Event Log, etc.) this can significantly increase the CPU load on the monitoring system and decrease the program's performance. We recommend you to use larger time intervals (for example, 1-2 minutes) for such checks.
The time interval might not be held properly by the program in the following cases:
- The monitoring database contains a big number of hosts and checks while the maximum thread number is low(it can be changed in the program settings, in the "Monitoring" section) is low. So the application cannot use enough threads for that big number of checks with their short checking time intervals (the monitoring schedule is overloaded). You need to increase the number of threads (which might not be possible without a hardware upgrade) or increase the time interval to make the monitoring check schedule less loaded.
- If a host has several checks and the most of them are failed ("red"), this can generate problems for that host's monitoring schedule. One host is processed by one application's thread. If all checks for that host are faulty, the thread will "hang" waiting for all timeouts of those checks to run out one after another. So the thread can return to the first check later than than the configured time interval.
![]() Check execution priority (Running order)
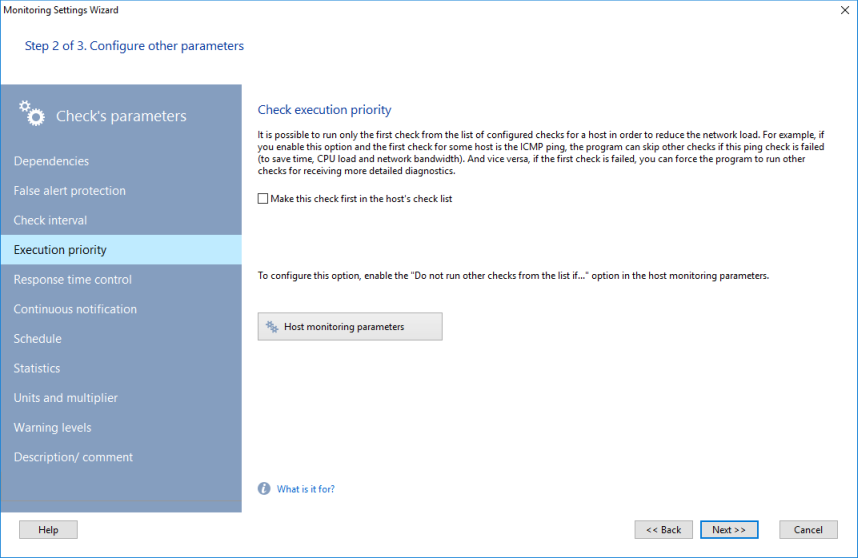
Check execution priority (Running order)
In order to decrease the CPU load and used thread time, the program can be configured to execute the first check only and skip all other checks if the first check is failed. For example, if the first check is ICMP ping, you can skip other checks if the ping does not respond. And vice versa, the program can run further checks in the list for more detailed diagnostics of the failure if you need.
Enable the "Do not run other checks from the list if..." setting in the host parameters to enable this function. Make the necessary check first by selecting the "Make this check first on the host's check list" on the "Execution priority" tab of the check parameters on the Step 2.
The program can raise alerts and consider the check as failed if the check's response time (the time spent on the monitoring check execution) is larger than the configured threshold (in ms). If you select the "The check is failed if its response time is larger than"option and set the timeout limit, the program will consider the check as failed even if the check is completed successfully, but the response time is larger than that limit.
The program supports two methods of the alert notification when a check is passed or failed.
- The first method is to send a notification when the check state is changed (from "passed" to "failed" and vice versa). This notification is given once. The next notification will be generated when the state changes back.
- The second method (continuous) is to send notifications always while the check's condition is satisfied.
These notification methods are global and affect all checks. It can be set in the program settings.
If you need to enable the continuous notification for only one check, this is possible using this section of the check's parameters. If you enable this option, the program will generate the "failed" notifications on every check attempts according to the time interval used until the check status is changed to "passed".
Please note that this option does not enable or disable the notification itself. This can be set on the Step 3 of the Wizard.
Some checks should be run strictly in working or non-working time. For example, there is no need to check workstations or printers on the weekend spending the monitoring server's resources. You can specify days of week and time for executing your check. Or, leave these settings unfilled if you need to run the monitoring constantly.

During the process of monitoring, the program stores the monitoring results statistics (response times of all the checks) in its internal file database. When there are a lot of hosts added and monitored, the stats files can take up to several hundreds of megabytes per year. You can change the stats storing settings in the Edit Host window, on the Statistics tab. If some devices and their performance are not critical, you can disable storing their response times to save your disk space and CPU time. Disable the Store response time stats option to do that. The stats files can be cleared automatically when they reach a specified size limit. This can be configured in the program settings (the Statistics section).
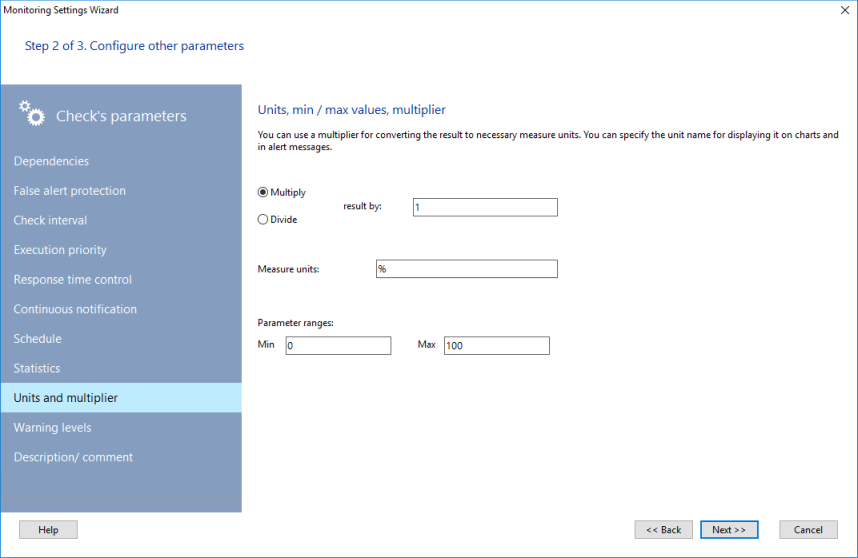
You can convert the check's results to necessary measure units using this option. Specify a multiplier or a divisor for that.
For example, the free disk space check gets the free space in bytes (it is not comfort to configure conditions with such big numbers). You can specify a divisor equal to 1048576 (1024*1024) to convert bytes to megabytes. After that, you can configure conditions and warning limits in MB. Charts will also display the data in MB.
You can also specify the measure unit name here. It will be used on charts and in the notification messages.
The min-max values are used for proper scaling and displaying the parameter's current value on visual indicators and gauges on the graphic map. Learn more about this in the Dashboard pane (Indicators and gauges) topic.
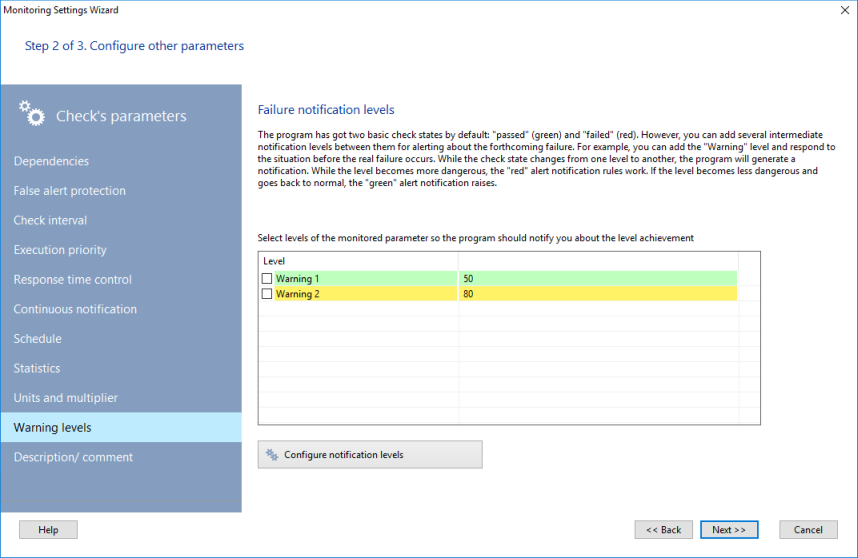
The program supports two basic check states and alert levels: "passed" (green) and "failed" (red). If you want, you can add intermediate warning levels for generating alerts on events when the situation is close to a failure but it is not the failure yet. For example, you can add the alert level called "Warning" and respond to situations when the controlled parameter's value is still acceptable but close to the failure range. When the check state changes from one alert level to another, the program will generate a notification. When an alert level changes to the "greener" level, the "green" type of alert will be raised (you will get the "passed" check's notification and messages). And vice versa, if the alert levels goes to the "red" zone, you will get the "failed" notification.
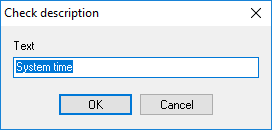
You can add an individual description to each check. The program can display these descriptions in the notification message texts (using the %DSC substitution key). The description can help you to distinguish checks of the same type on charts and in lists. You can specify the information on what parameters are monitored by this check and in what measure units.
To create a description for one or several checks, please do the following:
1. Select one or several checks on the Check List.
2. Bring-up the context menu and select Check description.
3. Enter the description text on the Check description window and click OK.
You can save a monitoring check as a template and apply the saved check template to other hosts if you want to apply the same check to other devices. To create a check from a template:
1. Select a check (or several checks) on the monitoring list. To select several checks, hold the CTRL button. Open the context menu and then select the Create Check from Template item.
2. On the Check List window, select monitoring checks to be copied to the hosts selected on the Step 1.
3. Click OK. The checks selected on the Step 3 will be applied to the hosts selected on the Step 1 with all their settings (except the host address).
To edit a check's parameters:
1. Select a check on the Check List.
2. Open the context menu and then select the Edit Check item.
3. That will open the Monitoring Configuration Wizard window.
4. Edit parameters as necessary (see Adding New Check). Click Next >> and then click Finish. The new check parameters will be saved and take effect immediately.
The parameters are saved automatically and take effect immediately.
To edit a check's action:
1. Select a check on the list.
2. Open the context menu and then select the Configure Actions item.
3. That will open the Monitoring Configuration Wizard window on the Step 3.
4. Edit actions/notifications as necessary and then click Finish.
The configured actions are saved automatically and take effect immediately.
You can perform this procedure by selecting a check or several checks on the list and clicking an icon of necessary action on the information pane.
To delete a check:
1. Select the check line on the list.
2. Open the context menu and then select the Delete Check item.
The selected check will be deleted from both the monitoring list and the program's .ini file.
To temporarily disable a check without deleting it:
1. Select the active check line on the list.
2. Open the context menu and then select the Disable Check item.
Disabled checks are highlighted with yellow color.
To enable a disabled check:1. Select the disabled check line on the list.
2. Open the context menu and then select the Enable Check item.
Enabled check is highlighted with its original color (corresponding to its last state).
The enable/disable check flag is saved and takes effect automatically.
To force run a check without waiting for its turn in the monitoring queue, do the following:
1. Select a check on the Check List.
2. Open the context menu and select the Force Check item.
The check will be executed and updated immediately.