To add a group:
1. Open the context menu for the host list and then select the Add Group item.
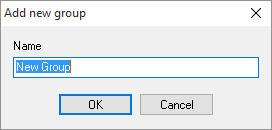
2. In the window that appears, enter a name for the new group. Click OK.
The new group is created at the root of the host tree.
To add a subgroup:
1. Select a group on the host list.
2. Open the context menu and then select the Add Subgroup item.
3. In the window that appears, enter the new group name. Click OK.
The new group will be created in the selected group.
To rename a group:
1. Select the group to be renamed on the host list.
2. Open the context menu and then select the Rename Group item.
3. In the window that appears, enter the new group name. Click OK.
The name of the group on the tree will be replaced with the value you have entered.
To delete a group:
1. Select the group on the host list.
2. Open the context menu and then select the Delete Group item. Confirm the action by clicking Yes on the prompt that appears.
The selected group will be deleted from the tree. All subgroups and hosts with checks included in it will be deleted as well. Changes are saved to the .ini file immediately.
To add a new host to the monitoring list:
1. Select the group on the host list.
2. Open the context menu and then select the Add Host item.
3. In the window that appears, enter the required host properties. A mandatory property is host name or address.
Host properties:
Host name or address
The host's DNS name or IP address. The value of this field is the starting point for all network functions of the program. The field is case-insensitive.Caption
The device's displayed name. By default, the host's name or address is used as the host's caption. You can change the caption to any text you need.Type
Device type serves for visual distinction of hosts on the tree. Each type is accompanied by an identifying icon.MAC address
The application can respond to a certain check result by turning the sleeping computer on. To ensure the successful operation of the computer turn on function (Wake on LAN), make sure to have specified the network adaptor's MAC address once for each host. MAC addresses can be obtained from running hosts automatically or entered manually.Check interval
Check interval time span during which the device will not be checked. The default value for this parameter is set automatically when a new host is added to the list. The default value is 60 seconds. You can set a check interval for all devices on the list at once by clicking the corresponding button in the Monitoring section of the application settings window.Change host address in alert settings
If you are changing the device's host address, this setting affects on checks associated with the host. The old host address will remain in check settings if the option is disabled. When you enable this, the address in all host checks will be changed too.Get dynamic IP by MAC
This option allows you to monitor hosts with a dynamic IP address that can constantly change. When this option is enabled, the program first tries to obtain the current IP from the specified MAC, and the host checks are executed after that. If the program fails to obtain the IP by MAC, checks for this host are assigned the special status "Unable to determine IP by MAC" and will not run.
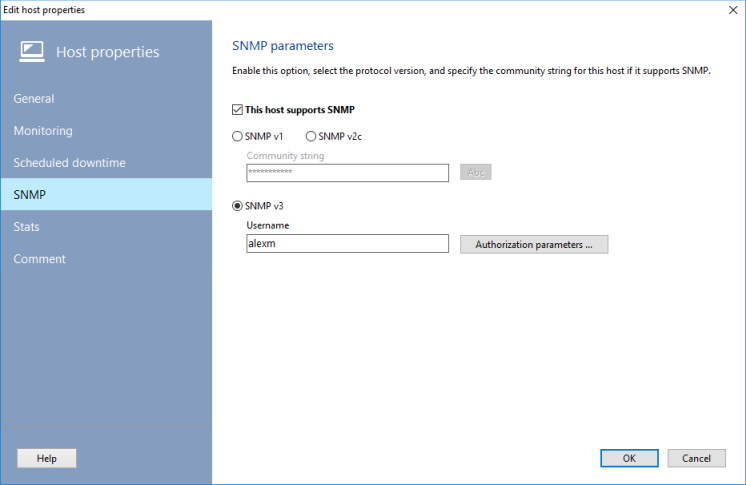
SNMP
For certain types of checks, the application needs to know the Community of the host (for devices supporting management over the SNMP protocol.) You can set this parameter by selecting the SNMP agent is running option.
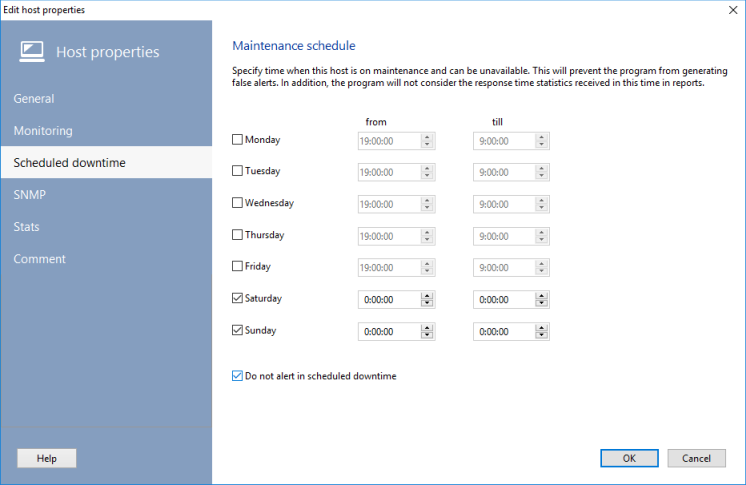
Scheduled downtime
If a device being checked (e.g., server) is configured for a scheduled reboot within a 24-hour period, the application will not respond to the event with an alert if you specify the period for the scheduled downtime of the device. You can set a specific day of week for having scheduled downtime.
Statistics
While the program monitors network devices, it collects the response times and stores all the values in the internal file database for displaying charts and generating statistics reports. If there are quite a lot of devices being monitored on the network map, the size of the files storing the stats can reach hundreds of megabytes per year. You can turn off storing the stats for particular devices on the Stats tab.
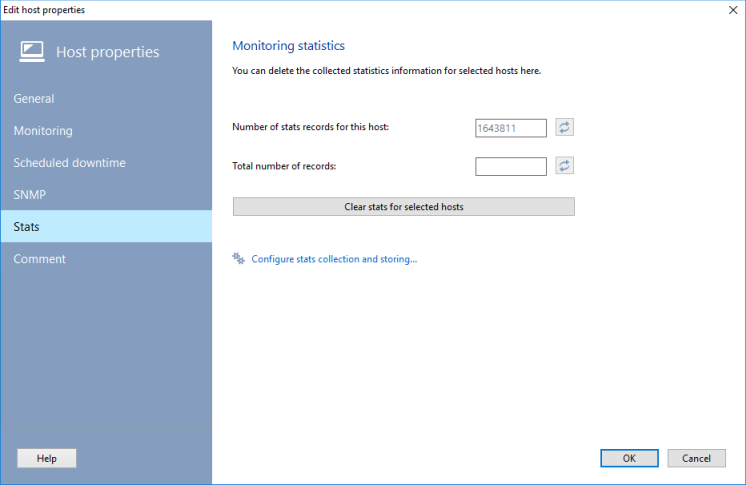
Remove the selection from the "Store response time stats" setting for non-critical network devices (user workstations, for example). This will help to decrease the disk and CPU load on the machine where the network monitor ia running.
On this window, you can also see the file size occupied by the stats database (for selected hosts and for all hosts on all maps). You can clear the stats for the selected hosts by clicking the "Clear stats for selected hosts" button.
The program builds the response time charts and diagrams based on this statistics data. Create them using the Reports menu.
The program can manage the statistics file size automatically and delete a part of the stats when necessary.
This Stats tab is only displayed when you edit a host's properties.
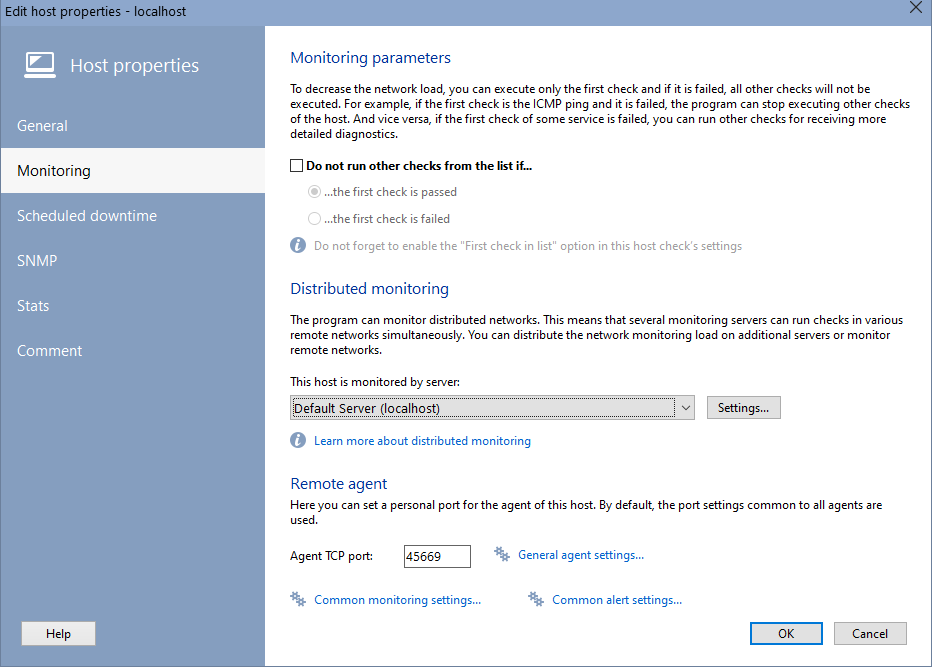
Monitoring
On the Monitoring tab, you can select whether the program should run further checks after the first check is failed (or succeeded) or not. This helps decreasing the network and CPU load.
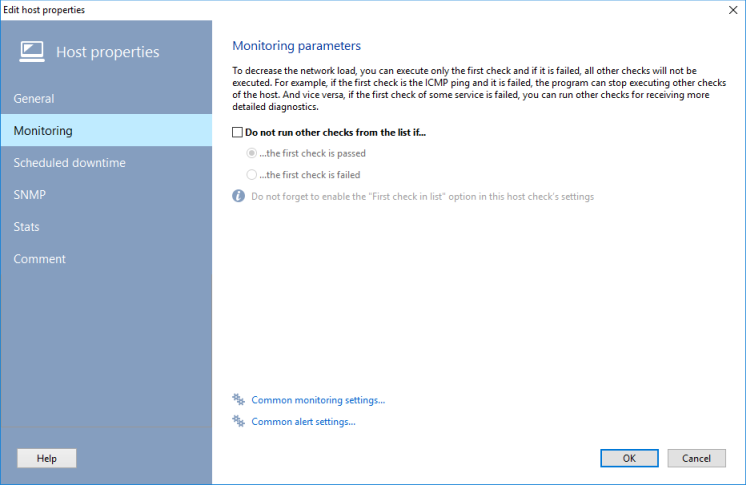
For example, the first check can be the ICMP ping. You can force the program to cease running further checks if the first ping check does not respond.
Distributed monitoring (in the Pro version)
The Pro version has got additional options on this tab. This version of the program supports the distributed monitoring mode. This means that checks can be executed by several monitoring servers located in various networks. The load can spread over these servers and you can monitor remote networks this way.Here, you can specify a specific monitoring server for executing this host's checks. You can learn more about the monitoring server list configuration here: Distributed monitoring - Managing monitoring servers.
If no monitoring server is specified here, the host's checks will not be run and the corresponding message will be displayed in the status line for the checks.
Remote agent (in the Pro version)
Here you can set a personal port for the agent of this host. By default, the TCP port settings are common to all agents.
Comments
Each host entry can be accompanied by a user comment. In this field, you can store the information about the computer user, the system hardware information, a list of software, etc. There is a mechanism for selecting attributes from the list for your convenience. The list of attributes can be expanded in the program settings.The attributes can be used for substitution via keys into commands of the custom menu items.
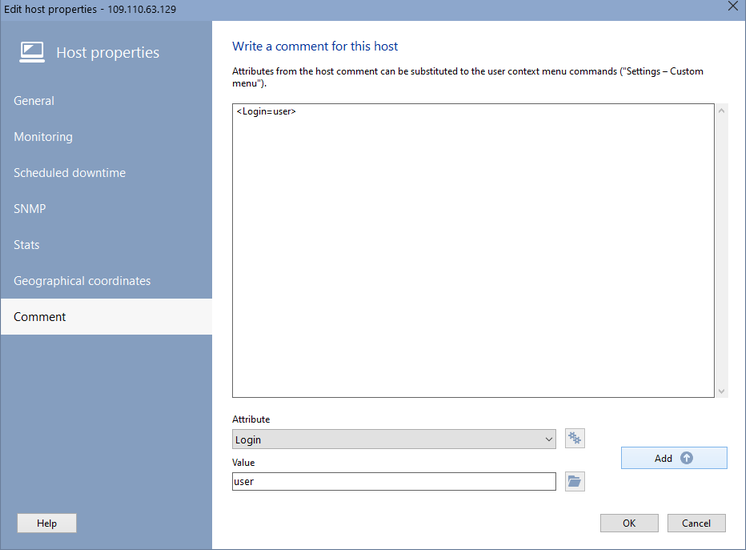
These attributes can be exported to the hosts report (Reports | Report on hosts).

Configuration (Pro version only)
When monitoring the switch configurations, the program saves their base (reference) state in files, creating a kind of backup. If the host has Switch Configuration checks configured and running successfully, you can view saved configurations in this section of the host settings: startup-config, running-config, and vlan.dat.The configuration snapshot date and a change indicator, if any, are also displayed here.

When the properties are set, click OK to continue. The new host will be added to the list, and the default checks will be assigned to it. New information is saved to the .ini file automatically.
Using templates during the host creation can significantly help and speed up the monitoring system configuration. For example, if each host is complex and contains several checks that require testing several parameters with various authentication settings and dependencies, the configuration of each host can take a lot of time. Instead of that, you can configure your first complex host, and then use it as a template and copy all those settings to your next hosts replacing just the host address (it will be replaced automatically in the host checks too). Addresses will be replaced in dependent and calculated checks as well.
To create a host using a template do the following:
1. Select a group in the host list.
2. Open the context menu and then select the Create host using template item.
3. Select a host which will be used as template for new hosts on the list displayed. Click OK. A new host with checks will be created in the tree and the host monitoring will be started automatically.
![]() Importing hosts from text file
Importing hosts from text file
If you have a text file with addresses (IP or DNS) of your actual network hosts, you can import them from the file and add the hosts into the program. This can help you to create the monitoring database easily without any network scanning, waiting until all your devices are online, and adding offline devices manually. To import hosts from a text file, select the Hosts | Import from text file... menu item and open your file. The hosts will be added to the monitoring list and the default checks will be assigned to them.
The file can contain the following information in addition to host addresses: comments, IP and MAC addresses, displayed names delimited by semicolons. The file format is the following:
Host_name_or_address;IP;MAC;Displayed_name;Comment
For example,
mypc;192.168.1.1;00-AA-BB-CC-DD-FF;My computer;Computer in living room
192.168.0.1;;;Router;
To edit host properties:
1. Select the host on the list.
2. Open the context menu and then select the Edit Host item.
3. Edit properties as necessary in the window that appears (see Adding host). Click OK to save the changes.
Changes take effect immediately.
To delete a host:
1. Select the host on the list.
2. Open the context menu and then select the Delete Host item. Confirm the action by clicking Yes in the prompt that appears.
The selected host will be deleted from the monitoring list and file along with its checks.
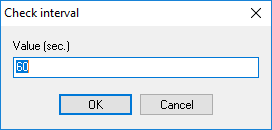
To edit check interval for a host:
1. Select the host on the list.
2. Open the context menu and then select the Edit Check Interval item.
3. In the window that appears, enter the new interval value. Click OK.
You can also edit check interval from the host property editing window.
To force check a host, without waiting for its turn in the monitoring queue:
1. Select the host on the host list.
2. Open the context menu and then select the Force Check item.
The check will start immediately.
![]() Check filter creation (in the Pro version)
Check filter creation (in the Pro version)
Filters allow you to form a list of host checks selected according to specified criterias. For example, you can display only failed checks, or only one type of checks, or checks with a given keyword in a comment. Filters do not affect the checks themselves in any way and only help to group them in the list according to the set conditions.
To create a check filter you need:
1. Select a host in the list.
2. Call the context menu, select the Create check filter item.
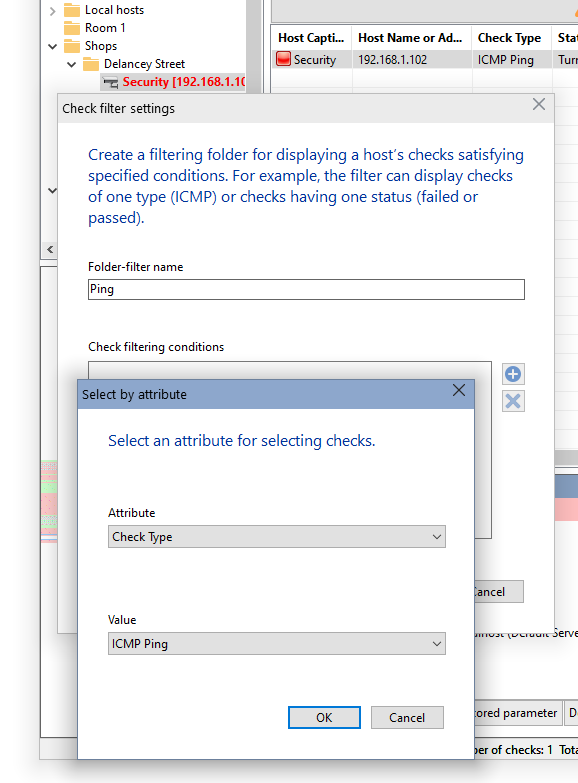
3. In the Check filter parameters dialog, specify the filter name under which it will be displayed in the list of hosts.
4. Add check selection rules to the list. Specify the attribute by which the checks will be selected for displaying and its value. For example,
Attribute "Status" - Value "Failed" (this will display all failed checks for this host).5. Click OK on all dialog windows.
After creating a filter, a new nested node will appear for the selected host. When you click the new filter, a filtered list of checks will be generated and displayed.
![]() Adding "lost" hosts (in the Pro version)
Adding "lost" hosts (in the Pro version)
In exceptional cases, when the program is running, it may happen that when you delete a folder with hosts, it will be deleted, but the hosts themselves will remain in the database. These hosts may have active checks that will be performed, loading the system, but there will be no access to manage them. In order to make such hosts and checks visible again, there is the Add "lost" hosts function (in the main menu Hosts).
If such hosts exist in the database, they will be added to the host list, from where they can be added back to the folder.