Our Monitoring Application allows you to scale up the monitoring process and even and setup the distributed monitoring system. It means that one Database of hosts and checks can be processed by as many Monitoring Services on different hosts as necessary.
This architecture has a number of advantages:
1. It makes the monitoring system more robust. Even if one Monitoring Server or Monitoring Service fails, the monitoring will not stop completely: Other Monitoring Servers will continue doing their job. You can duplicate critical checks by giving the job to two or three different Monitoring Servers.
2. It reduces the load on the Monitoring Server. The polling process is rather resource-intensive. If the Monitoring Database is large enough (more than 10,000 checks), the Monitoring Server may be unable to handle all that load effectively. Giving part or the job to another Monitoring Server will dramatically reduce the load on the first Monitoring Server.
3. It allows you to implement centralized monitoring of remote networks and setup the distributed monitoring system. You can install the main part of the Monitoring Application on your company's central server, and deploy additional Monitoring Servers in remote offices. Then you can view the remote networks' status in a web browser on your computer or mobile device.
When you install the general part of the application, the Monitoring Server is also installed by default. That Monitoring Server will handle all the created polls until you create another Monitoring Server and modify the respective parameter in the host settings.
You can deploy an additional Monitoring Server quickly and easily, just do the following:
- Install the Monitoring Service on any other host. (Please refer to the Installing a Monitoring Server section for instructions.)
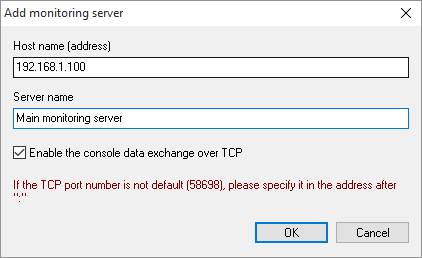
- Add an entry about the new Monitoring Server to the database (see the figure).
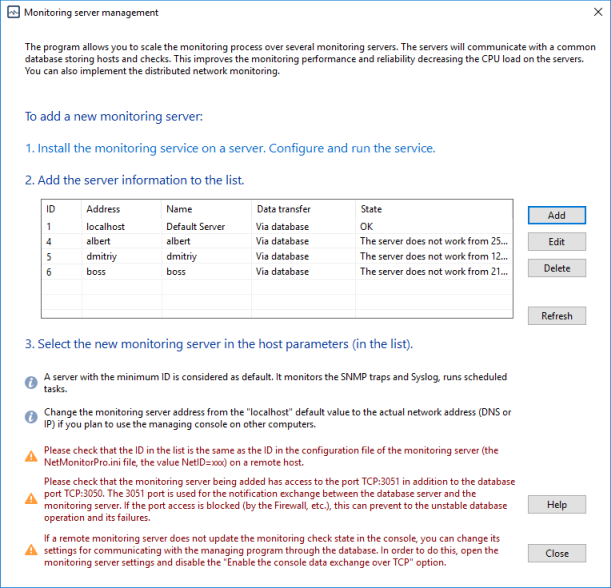
- If you add a Monitoring Server, the Monitoring Application will automatically assign it a unique ID. That ID will be passed to the Monitoring Service and saved to its configuration file. When the Monitoring Service is loaded, it will read its ID and do the specified checks. Make sure that the Monitoring Service on another server successfully got its ID, and that the ID is added to this file:
<drive>:\Users\All Users\10-Strike\Network Monitor Pro\NetMonitorPro.ini
or
<drive>:\ProgramData\10-Strike\Network Monitor Pro\NetMonitorPro.ini
in this section:
[SERVER]
NetID=1
The maximum number of monitoring servers per one database is 40. This is the technical limitation and the feature of the database used (Firebird). Our licensing model allows you to choose licenses with maximum 5-10-15-etc monitoring servers according to your needs.
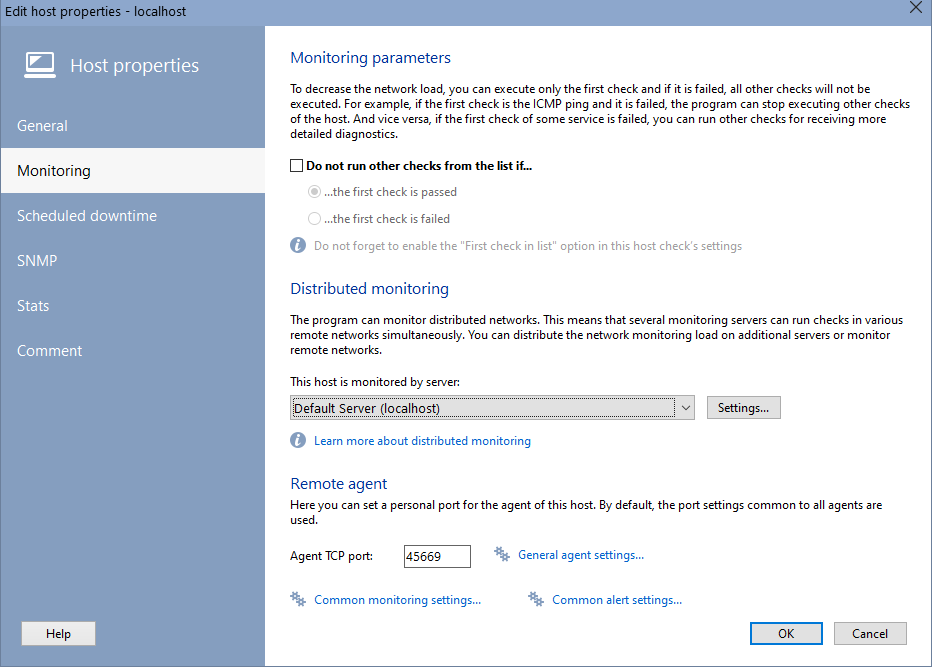
- After installing the Monitoring Service and adding the new Monitoring Server to the list, you can define which hosts in the Monitoring Database should be polled by that Monitoring Service. To do it, open the host parameters and select the appropriate server from the server list. The changes will become effective immediately: The "old" Monitoring Service will stop polling the host, and the "new" Monitoring Service will start doing that.
You can also use the Manage Monitoring Servers dialog to suspend the monitoring process on some server, and to resume it later.
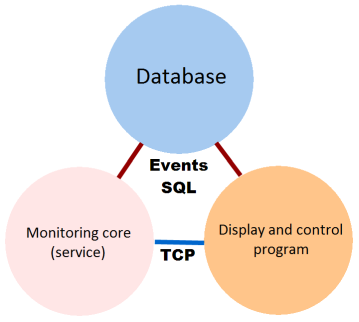
The Graphics Console always stays in touch with all the Monitoring Services in order to display the latest status of all polls, response times, and other parameters. The Graphics Console and the Monitoring Service can communicate with each other using two different methods:
- Directly through a TCP port (which you can configure in the Monitoring Application's settings). The Graphics Console sends control instructions to the Monitoring Service, and the Monitoring Service sends the polling results and the instructions on delegating some types of signaling that it cannot do on its own to the Graphics Console.
- Through the common Database by using SQL queries, triggers, and Firebird Events (signals that the Database sends to its clients). For this mechanism to work, you need to whitelist port 3051 (or another port as per the firebird.conf configuration file) in the firewall settings. This method is reliable, too, though sometimes (if the monitoring database is very large) it can be resource intensive.
The Graphics Console automatically checks if the TCP connection can be established. If the connection establishment fails, the Graphics Console will communicate with the Monitoring Service via the Database. It means that the data channel is effectively duplicated.
Disabling Inactive Monitoring Servers
Monitoring services that have been installed on other servers may be temporarily disabled if you do not need them. This will help you to avoid unnecessary notifications about the monitoring servers' failure state in the program.
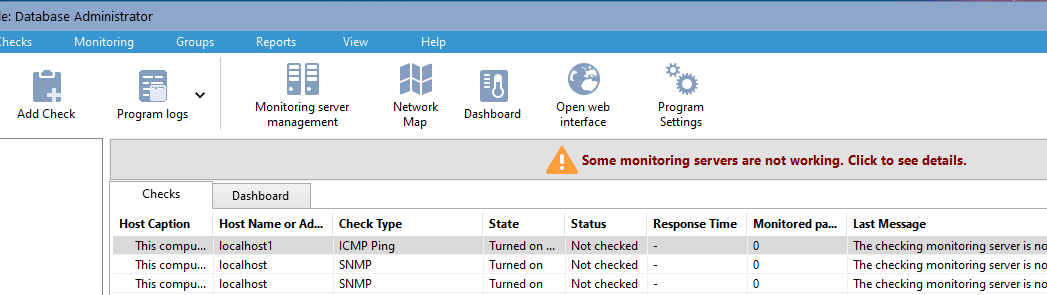
To do this, simply open the list of monitoring servers and disable those that are not currently in use by clicking the Disable button. The error message will disappear automatically after some time.