Installing the Main Part of the Application
You can download 10-Strike Network Monitor Pro as one distribution package that contains all the other parts: a separate distribution package for installing an additional Monitoring Server, the Remote Agent distribution package, and the Web Interface distribution package. The installation is quick and easy:
- Run the network-monitor-agent.msi installer file and follow the installation steps.
- The installer will automatically install the Database with the default settings (with several test checks), the Firebird DBMS (both the server end and the client), and the Monitoring Service. It will also add the necessary permissions for the Monitoring Application to Windows Firewall.
- Set a new database password and database connection parameters.
The Monitoring Application will be ready to use immediately after its installation.
Installing an Additional Monitoring Server
To install an additional Monitoring Server, you need to use an additional installer. You can find it in the \Install\Service\ subfolder of the application's installation folder in Program Files.
- Copy the network-monitor-agent.msi file to another server, and then run that file.
- Follow the installation steps.
- When the server configuration dialog box appears, enter the database connection password that you specified when installing the main part of the application. If you did not change the existing password (by default), check the same box here, too.
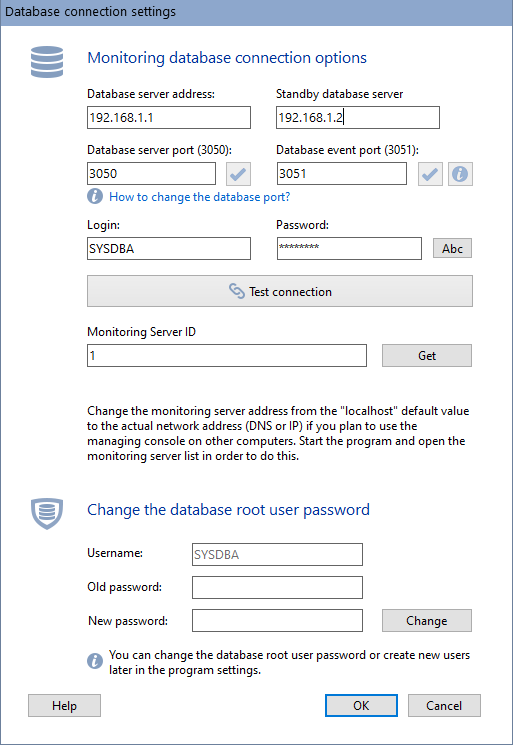
- Specify the ID of the new Monitoring Service. If you have not added any servers in the Monitoring Application yet, you need to set the ID at 0, otherwise enter the value that you assigned to the server when adding it to the list. Read more in the Managing Monitoring Servers section.
- Check the database connection. If the connection has been successfully established, complete the installation of the Monitoring Server.
- Make sure that the Monitoring Service is running.
Please note that the Graphics Console file is copied to the installation folder together with the Monitoring Service, so that you can run the Graphics Console on that server when necessary. To connect to the Database, the Graphics Console uses the same configuration file as the Monitoring Service. It means that you can run the Graphics Console just to check if the Monitoring Service works.
Installing the Remote Agent
The Remote Agent is installed on computers to monitor the S.M.A.R.T. parameters of hard drives, system performance parameters (CPU load, free memory), files, or folders. In theory, all checks but S.M.A.R.T. can be done remotely. However, sometimes you need to do some checks locally (for example, due to restrictions imposed by the local network's security policies). If that is the case, you can use the Remote Agent. It is a Windows service that communicates with the Monitoring Service through one TCP port. You can configure the port.
To install the Remote Agent, you need to do the following:
- Copy the Remote Agent installer file network-monitor-agent.exe from the \Install\Agent\ subfolder of the Monitoring Application's main part installation folder in Program Files to the remote computer, and then launch that file.
- Follow the installation steps.
- After the installation, you can change the TCP port used for communication with the Monitoring Service by running the Program Files (x86)\10-Strike Network Monitor Agent\NMAgentCfg.exe file.
The Remote Agent will be ready to work immediately after its installation.
Read more about the Remote Agent's installation and operation in the Installing and Configuring the Remote Agent section.
Installing the Web Interface
You can install the Web Interface on any server from which you can connect to the Monitoring Application's database. The Monitoring Application's installation package includes the Web Interface installation package that contains Java Runtime Environment (JRE), which is necessary for the Java application to run, and the Jetty web server. Both programs from the Web Interface installation package are intended for Windows, but you can download from the official website versions for other platforms, too.
To install the Web Interface, do the following:
- Copy the network-monitor-pro-webservice.exe distribution file from the \Install\Web\ subfolder of the Monitoring Application's main part installation folder in Program Files, and launch that file.
- When selecting components for installation, check the Install Java box if Java Runtime Environment has not been installed on the host yet.
- Follow the remaining installation steps.
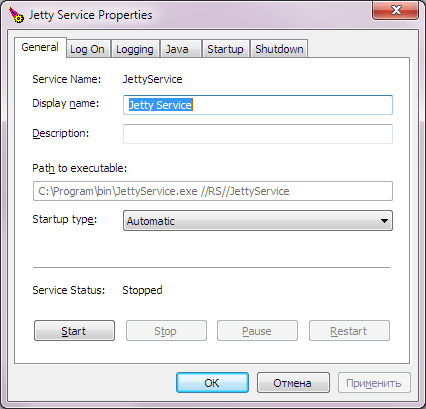
The installer will automatically configure the Jetty web server for the Web Interface and allow you to run Jetty as a Windows service. You can change the service's settings by using the JettyService.exe tool in the \Web subfolder in the Monitoring Application's installation folder.
Make sure that the Web Interface works properly:
- Launch the web browser.
- Enter http://localhost:8080/netmonitor/ in the address bar, and press Enter. A graphics interface window for managing the monitoring should appear. You can change the port (from the default 8080) in the Jetty settings. When accessing the Web Interface from another host, enter the web server's address instead of localhost.