In the section Common you may configure the following settings:
Minimize on ESC
When this option is selected, you may minimize the application by pressing the ESCAPE key on the keyboard. Please see the section Hotkeys for information on other hotkeys available in the program.Shortcut on desktop
When this option is selected, the program creates a shortcut on the Windows Desktop. This shortcut can be removed from the desktop by deselecting this option.Autorun
The client part of the program (that displays monitoring results) will be started automatically each time you start Windows.Minimize on startup
The program will minimize automatically on its startup.Folder for data and program settings
By default, all the program settings and data are stored in the user profile folder. You can move these files to another location.
How to do this (links to our FAQ):I have configured the monitoring checks on one computer and would like to move all the settings and checks to another PC. How can I do this? Where does the program store stats, reports, and other data?
In the section Monitoring you may configure the following settings:
Maximum checking threads count
the amount of program threads which check devices simultaneously. Avoid rising this parameter too much. This can slow down your computer. The recommended value is 35 threads or less. Consider the fact that Windows XP SP2 does not allow making TCP connections to more than 10 different addresses per 10 seconds (excessive threads are slowed down by the system). ICMP ping is not affected by this restriction, however.Process priority
priority, which a background ping process gets when sharing system resources. The recommended value is Normal.Default interval between checks (in seconds)
default period of time, in which the program starts querying hosts again. The recommended value is 120 seconds. Depending on the results (whether it responds or not), the program produces notifications. You can reassign checking intervals for all hosts by pressing the Apply to all hosts button.Check list updating period (Pro version only)
If the exchange between the database and the console is configured to operate via the database (learn more about this exchanging method), the check states are not updated immediately in the check list. The statuses are updated with the frequency specified in this parameter. The default value is 5 seconds. This setting also affects the host icon updating on the graphic map.Wait till the check finishing on the service stop
When the monitoring service ("10-Strike Network Monitor (Pro) Service") is being stopped, it usually tries to stop all the currently running checks carefully and waits till its termination. Sometimes, this can take a lot of time. If you disable this setting, the service will not wait till the active check termination. Learn more about this setting in our FAQ.Terminal name for connecting via SSH
This parameter is used in the SSH verification to connect to a remote server. Some SSH servers are picky about the terminal name and may throw the "Unknown terminal type" error when on the connection. In this case, you need to set the correct terminal name. On Linux, you can find out the terminal name with the command echo $TERM.
When a new host is added to the list, it the program can add the following default monitoring checks to it:
Network availability (ICMP ping)
Response timeout (in milliseconds) - length of time, within which the program expects response from each host;
Number of packets - if the number of packets is greater than one, if the negative response is received for the first packet, the remaining packets will be still sent to the remote host. This eliminates the possibility of false detection of an object status when a single packet is lost.
Packet size - size of ICMP packets, in bytes.
Performance (WMI)
When a Windows host is available via WMI, the program can automatically add and assign the performance checks to it, which include:
- CPU load
- Memory usage
- Disk load
- Free space on disks
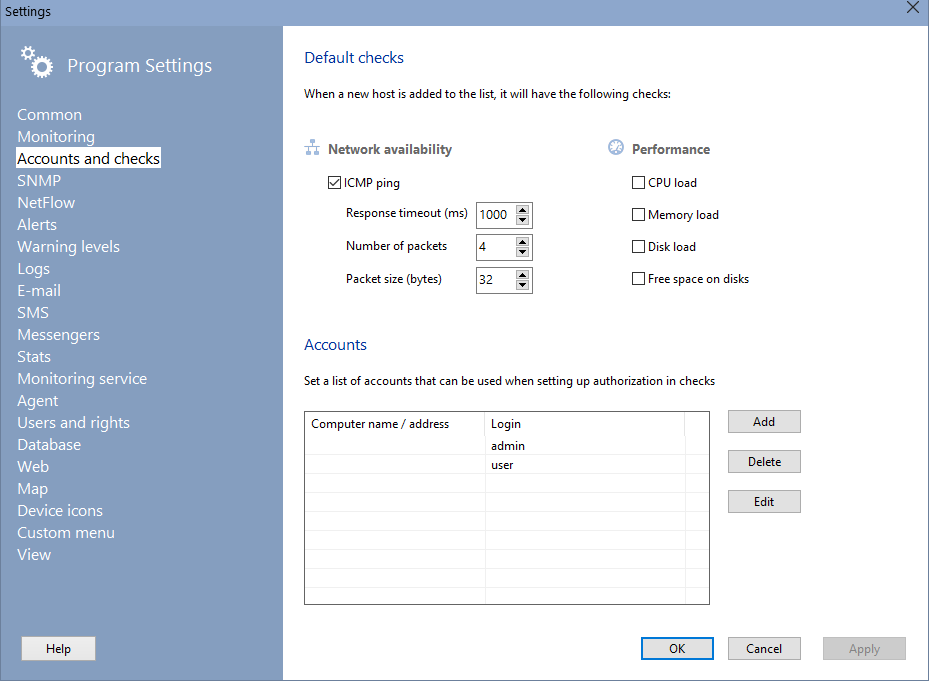
To access the host via WMI, you need to set up administrator accounts with the appropriate rights for connecting to WMI remotely. The same accounts can be used for quick substitution of the username and password into the authorization fields in other functions of the program.
These settings affect the SNMP functions of the program.
Response timeout (ms)
You can change the response timeout for all the SNMP functions here.Use SNMP WinAPI
Enable this option if you are getting errors or the program is hanging while it performs the SNMP operations (getting the data from managed switches, monitoring SNMP values). This setting allows the program to use the WinAPI functions for communicating via the SNMP protocol, but these functions not always work correctly in the process of the multi-threaded background monitoring.SNMPv3 accounts
You can configure the SNMPv3 authorization accounts in the list located under the option. The accounts are used when connecting to various devices using a secure version of the SNMP v3 protocol. These entries can be used when setting SNMP check parameters (for ease of entry), when retrieving information, and in other functions where needed. The following data is stored in the program settings:
In program functions that require authorization for SNMP v3, it is enough to specify only the user name, and all other information for this account will be loaded automatically from the settings.
- Username
- Security level (NoAuth, NoPriv - no passwords, Auth, NoPriv - with one password, Auth, Priv - two passwords),
- Encryption protocol Auth (MD5, SHA),
- Auth password
- Privacy encryption protocol (DES, Trople DES, AES),
- Password Privacy.
Convert SNMP trap value OIDs to names
SNMP trap messages sent by network devices to the program usually contain the OID codes as value names (for example, 1.3.6.1.2.1.1.3.0=10). This is not comfortable for understanding the message meaning. The program can convert the digital codes to more symbolic names using the MIB tree (for example, .iso.org.dod.internet.mgmt.mib-2.system.sysUpTime=10).Replace text in SNMP traps
As in the previous option, the program can replace value names to any strings which can be defined in the table below. Our example value name 1.3.6.1.2.1.1.3.0 can be automatically replaced to "Uptime".
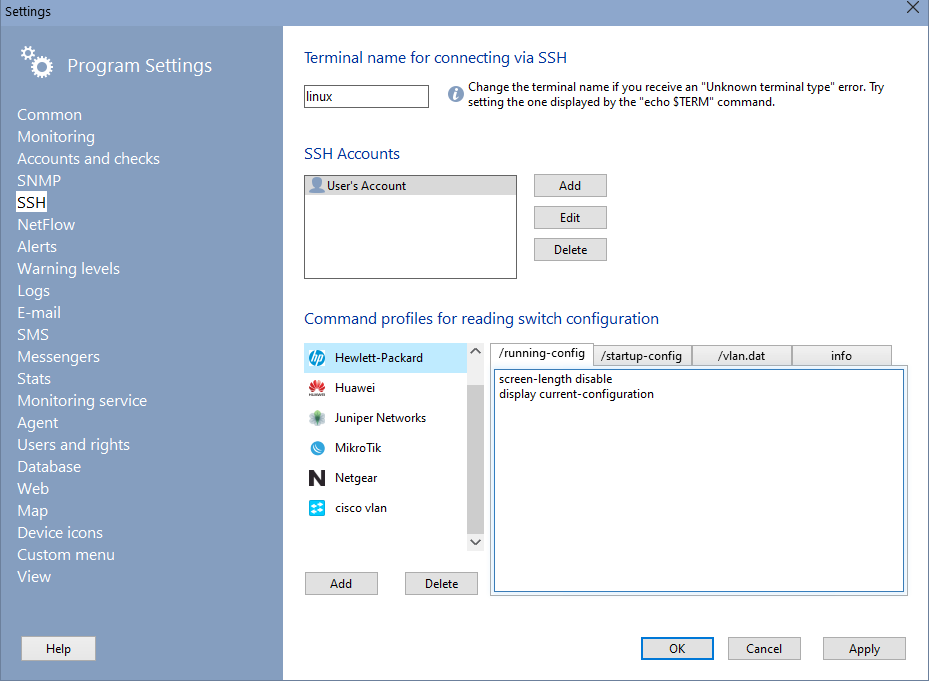
The program uses the SSH (Secure Shell) protocol to retrieve configurations of managed switches and various metrics for network monitoring. In this section of the program settings, you can set up accounts and other parameters for the data requests made via SSH.
Terminal name for SSH connection
This parameter is used in the SSH verification for connecting to a remote server. Some SSH servers are picky about the terminal name and can return the following error when connecting: "Unknown terminal type". In this case, you need to specify the correct name. In Linux, you can find the terminal name with the command echo $TERM.SSH Accounts
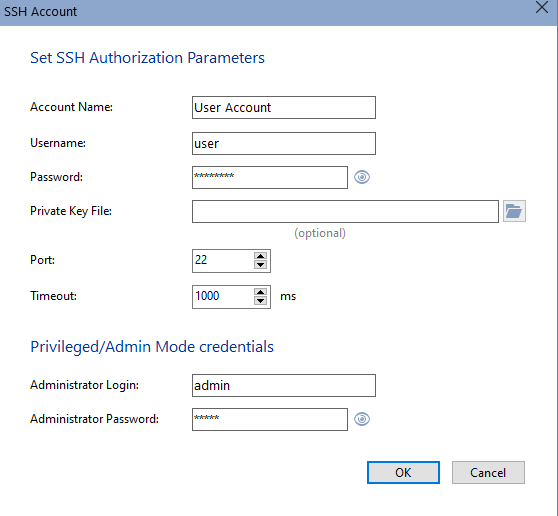
Configure the accounts once here, then easily select them from the list when creating new monitoring checks. These same accounts are used when scanning the network and finding switches to retrieve configuration files from. To use the "SSH" check and retrieve metrics from a remote host, simply set the login, password, and port. To retrieve the switch configuration, you must specify the administrator login and password to enter Admin mode.
Command profiles for reading the switch configuration
The program can read the switch configuration files startup-config, running-config, and vlan.dat. However, each network equipment manufacturer has its own set of commands for obtaining this data. The program includes ready-made templates for some major manufacturers. You can also add your own command profiles. If none of the predefined profiles work with your equipment, add your own profile using the Add button and enter commands in the /startup-config, /running-config, and /vlan.dat tabs. The last tab, info, contains commands for obtaining the switch model and serial number. Before using, try these commands in a standard terminal and ensure they return the required data. You can search for commands for obtaining information in the documentation or on the internet.
The NetFlow traffic analyzer is described in the Netflow v5/9 Traffic and Bandwidth Monitoring topic.
You can configure the following settings in this section:
Rise alerts...
always - when the host turns up or goes down (alerts rise on the program's start during the first check);
on device state changes - the program remembers the results of the first check and rises alerts only when a device's state changes.Message text, e-mail, SMS
These options define the text of a message which will be displayed on the screen, sent via e-mail or SMS when an alert raises (When check is failed and When check is passed). You can use the following keys for in the message text:%A - network address %H - host type (server, camera, printer, etc.) %T - type of the check (Ping, TCP, folder existence, etc.) %S - check's state (ON or OFF). We recommend using this key in email subjects to cut down its length. %D - current date and time %C - host's caption %U - current user %DSC - check's description (learn more) %RET - line break All the keys will be replaced by the corresponding values automatically by the program.
Play sounds without waiting for the previous sound's end
This setting allows you to play sounds without waiting for the previous sound's end in the program's notification functions.Show balloon tips in tray
When this option is selected, the program shows balloon tips in the system tray when host on/off monitoring alert arises (message text is set up in alert settings).
The program supports two basic check states and alert levels: "passed" (green) and "failed" (red). If you want, you can add intermediate warning levels for generating alerts on events when the situation is close to a failure but it is not the failure yet. For example, you can add the alert level called "Warning" and respond to situations when the controlled parameter's value is still acceptable but close to the failure range. When the check state changes from one alert level to another, the program will generate a notification. When an alert level changes to the "greener" level, the "green" type of alert will be raised (you will get the "passed" check's notification and messages). And vice versa, if the alert levels goes to the "red" zone, you will get the "failed" notification.
Each alert level can be defined as a per cent from the "failed" parameter's threshold value. When you add a new alert level, the program will ask that per cent value and the level name. The level color will be assigned automatically according to the threshold per cent used.
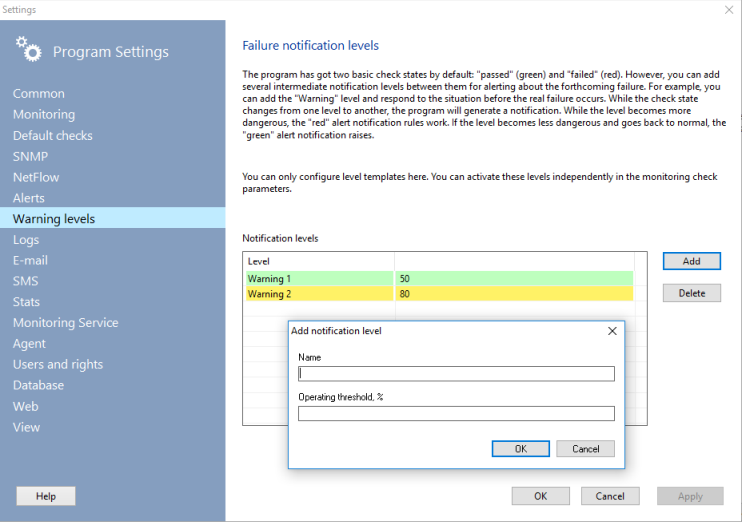
You can configure the alerting levels in this section. Each level of alerting can be activated in the check's properties.
In this section you may configure the following settings:
Alert log file name
Full path to log file.Append or overwrite
Actions for recording information to an existing log file. If Add is selected, the log will not be created all over every time the application starts. With the Overwrite option selected, the log will be cleared every time the application starts;Cut longer than
What the application must do when the log file has reached a certain size. The application can automatically manage the size of the log file, preventing it from growing over a certain value. When the maximum allowed size is reached, the application deletes the oldest records from the log.
This section of the program's settings configures mail server settings for sending e-mails:
SMTP server address
Mail server port (the default port for SMTP is 25)
Sender's e-mail address
Message subject (learn about the substitution keys in the Alerts section)
Code page
SMTP authorization required before sending
If your SMTP server requires authorization before sending messages, you will need to turn on SMTP authorization required before sending and enter your login and password.
1. The program can send SMS by sending E-Mail messages to the cellular operator's SMS server or any 3rd-party Email-to-SMS gateway. Therefore, you should first configure connection settings for the SMS server. In the SMS setup dialog, select a SMS server name or IP address (get this information from your operator's customer service), message composition rules (number in message body, text in message body, etc.), country code prefix (without the "+" sign).
Mail server settings can be defined at the Settings window (the section E-mail). If you have difficulties with configuring SMS or Email settings you can learn more about this issue in our FAQ: SMS Issues.
2. The second option for sending outgoing SMS messages is connecting a GSM cell phone to your PC and sending SMS directly.
GSM phone requirements:
- The GSM phone should support connection to a PC using a COM or USB cable. In the USB cable case, you will need to install a driver which will create a virtual COM port on your system (you will need to know this COM port's number). This driver is usually included to the software provided with your phone.
- The phone should also contain a GSM modem supporting basic AT commands.
Before trying to send an SMS using the program, you need to check that the phone's modem is operating well using special software provided with your phone ("PC Suite", etc.). After that, you can start configuring our program for sending SMS messages directly using your phone.
On the SMS settings dialog, select the second SMS sending option Send SMS via the GSM Phone. You need to select a necessary COM port, select Baud rate (57600 by default), and provide the AT initialization string (ATE0 by default). Other options are optional. You should not change it unless you know what you are doing. :)
Click the Test... button to test the connection with your phone. The program should gather some information from the phone and display it on the screen. If the test finishes successfully, the program likely will be able to send SMS messages.
Warning! The outgoing SMS will be charged as usually when you send them using your GSM phone. You should configure the monitoring SMS notifications having in mind you will have to pay for them. Long messages can be broken into several smaller messages.
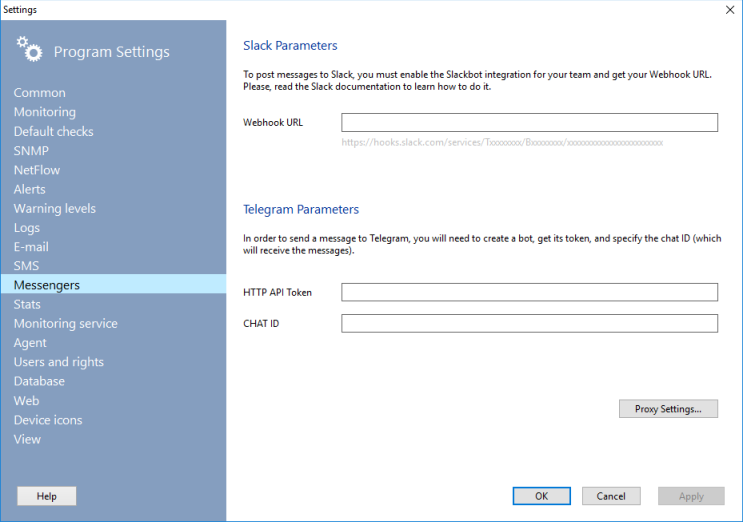
The program can send out alert messages using popular messengers Slack and Telegram. You will need to configure these services before sending messages from the program.
For Slack
- Register in Slack.
- Enable the Slackbot integration for your team and get your Webhook URL.
- Specify your Webhook URL in the corresponding field of the program settings. It looks like https://hooks.slack.com/services/Txxxxxxxx/ Bxxxxxxxx/xxxxxxxxxxxxxxxxxxxxxxxx
For Telegram
- Create a Telegram bot. Get its API token and the chat ID for receiving your alert messages.
- Specify these parameters in the settings.
Specify the proxy server parameters if necessary.
During the process of monitoring, the program stores the statistics on monitoring results (response times of monitoring checks) in its internal file database. For each host, the program creates and maintains one statistics file. When there are a lot of hosts added to the program and monitored, the stats files can take up to several hundreds of megabytes per year. The large amount of statistics gathered by the program can slow down its operation. It is recommended to clear or backup the stats periodically. The stats files (*.stat) are stored in the program working folder in the All Users profile: ...\10-Strike\Network Monitor\RTStat\
The program can automatically clear the stats for each host on the program startup when a certain file size limit is reached. To enable this feature, you need to select the Clear response time statistics for each host when it reaches the following size threshold option and configure the size limit in kilobytes. If you would not like to lose the gathered statistics, the program can make a backup copy of the files before the deletion. Select the Create a backup copy of the .stat file before deletion option to do that.
In this section of the settings, you can also watch the total file size of the statistics, create a backup archive, and clear all the files.
The Pro version stores the statistics data in the common database. The statistics data can be cleared using the built-in Task Manager. It is necessary to create special task for the statistics clearing and specify time for this operation.
For the Pro version, it is possible to delete statistics for the selected period (older than a week, month, year, etc.).
The host monitoring functions are implemented in a Windows service. This enables the continuous process of background monitoring which can run without any interaction with a user or administrator. By default, the monitoring service named "10-Strike Network Monitor Service" is installed automatically when you install the program.
In this section, you can manage the Network Monitoring Service:
Start and stop it
To stop the monitoring process, stop the service. (Important! When you stop the service, the monitoring process will be also stopped until you start the service)Install and uninstall the service
The service is installed automatically when the application is installed on the computer. If you have a need to remove the service without uninstalling the application, click on the Delete Service button.View current status
Change TCP port used for the console-service exchange
The service and the GUI (graphic console) communicate using a TCP connection. The default TCP port number used for this is 57698. If it is necessary, you can change this port here and use another free port available in Windows. After changing the port number, please restart the program and the service.
Please note, that in Windows Vista and newer editions of Windows, applications are launched with a current users privileges. However, managing services requires the administrator privileges. Therefore, the application is to be run on behalf of Administrator. Or use Windows standard service management mechanisms.
When you use the "MS SQL Server" check with the "Windows authentication" option enabled, it is necessary to run the monitoring service under a user account that belongs to a domain, AD, or MS SQL Server. In order to start the service under a necessary account, you need to do the following:
- Click the "Managing services" button (or start the Service Manager).
- Find the 10-Strike Network Monitor Service on the displayed window and open its properties using a double mouse click.
- Move to the "Log On" tab. Select the "This account" option.
- Click "Browse...", "Advanced...", and then "Find Now". Select a necessary user account Click "OK" and "OK" again.
- Enter the password of this account below in the "Password" and "Confirm password" fields. Click "OK".
- Restart the service.
![]() Agent (in the Pro version only)
Agent (in the Pro version only)
Agent is a special service with a TCP server side (available in the Pro version only) that can be installed on a remote PC for retrieving some specific information (that cannot be accessed using standard network protocols) and making possible the monitoring process of that information. Our Agents add support for monitoring the following parameters on remote systems (find the comprehensive Agent's check list here):
- CPU temperature
- speed of cooling fans
- voltage
- S.M.A.R.T. HDD parameters
- remote ICMP ping (i.e. the agent executes the ping procedure instead of the monitoring service or server)
- and other checks...
The program communicates with Agents using a TCP connection. The default port number is 45668 and you can change it here, in this section of the program settings. The remote Agents keep this port opened for incoming connections so it should be enabled in the Firewall on your and remote systems for normal operation. Learn more about Agents here Installing and configuring remote agents.
The Agent connection settings (necessary for the successful connection of the monitoring service with Agents) can be applied to all running Agents over the network on this windows.
These settings include:
- New TCP port
- Connection password
- IP address filter settings (addresses allowed to connect to the Agent)
Create a common set of settings for Agents and click the Apply settings to all agents button.
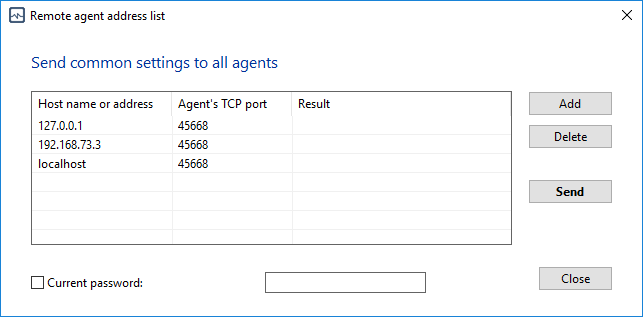
Enter your current connection password if it was set previously and click Send. You will see the result of sending the new agent settings to remote agents over the network in the Result field.
![]() Users and rights (in the Pro version only)
Users and rights (in the Pro version only)
The user management is described in the Users and rights topic. You can change the user settings here.
![]() Database (in the Pro version only)
Database (in the Pro version only)
The Pro version of the program stores all its settings in a database. You can change the database settings here.
![]() Web interface (in the Pro version only)
Web interface (in the Pro version only)
The Pro version of the program allows you to enable and use the web UI for accessing the monitoring results and configuring everything like you can do this using the regular GUI console. Learn more here: Program's web interface.
The Map section contains the map displaying and map editing settings.
Align map hosts to grid
When moving device icons across the map, they can be aligned to the grid with a specified vertical and horizontal step. This function helps keeping device icons and lines aligned on the map.
Map icon label format
You can display additional information on icon captions using special substitution keys: %N - host name (symbolic address), %IP - IP address, %MAC - MAC address, %C - caption on map, %DSC - comments. If you want to display only the host caption on the icon text, keep the key field empty or use the %C key.
![]() Configuring device icons and types on map (in the Pro version only)
Configuring device icons and types on map (in the Pro version only)
The program allows you to create various device icons on the network map (up to 50 different types). You can add your own device types in the program settings, the Device icons section. All types and icons are stored in the common database. When you create them once, you will be able to see these icons in all places where you start the program or access the web UI.
Each default device type has its own icon. You can edit these icons but cannot rename device types. If you need some specific new device type, create your own type (use the Add button), and specify a file for opening the device icon from it (the Icon file field).
The program can import device icons from the MS Visio icon library files (.vss or .vssx). Open a necessary file with icons and they will be added to the program. Thus, you can create your own device type and icon library.
Use the Default icon size setting for specifying a new icon's default size when adding it to the map.
Icons can be grouped into sets. A Set is a way of organizing a large number of device types, sort of like a folder. This helps to quickly find the desired device type in the list when creating a new host. By default, the program already has several icon sets: Main Set, Network Symbols, and CCTV. You can create your own set and add existing icons to it, or create and add new icons. When deleting a set, its icons are not deleted. In order to add several icons of devices to a new set, you need to select them in the list with SHIFT or CTRL and choose name of the target set in the drop-down menu of the button located below the list. You can manage sets (create, rename, delete) using buttons located under the left list of sets.
![]() User Menu (in the Pro version only)
User Menu (in the Pro version only)
Create your own map context menu and add commands to it for managing devices represented on the map. Commands can include an RDP connection to a PC or a server, connecting to telnet, opening the web interface in your web browser, or opening a network share.
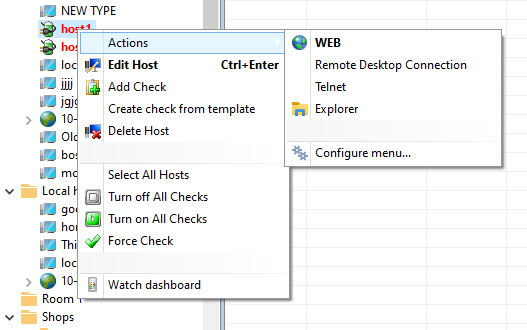
The user context menu is available and can be displayed in two locations: 1) the host tree (the monitoring list) and 2) device icons placed on the network map. All commands are displayed under the Actions sub-menu. The context menu Actions has got several commands by default. You can add your own commands using the menu itself. Click the Configure menu... item. This will open the program configuration window on the User menu section.
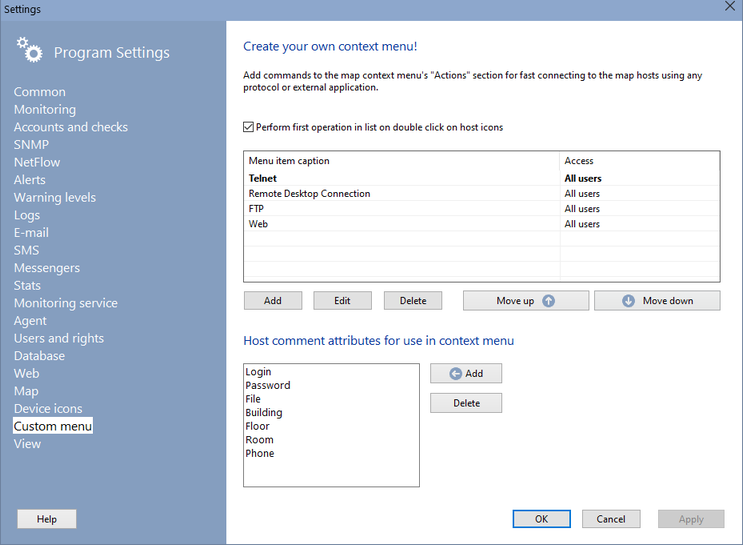
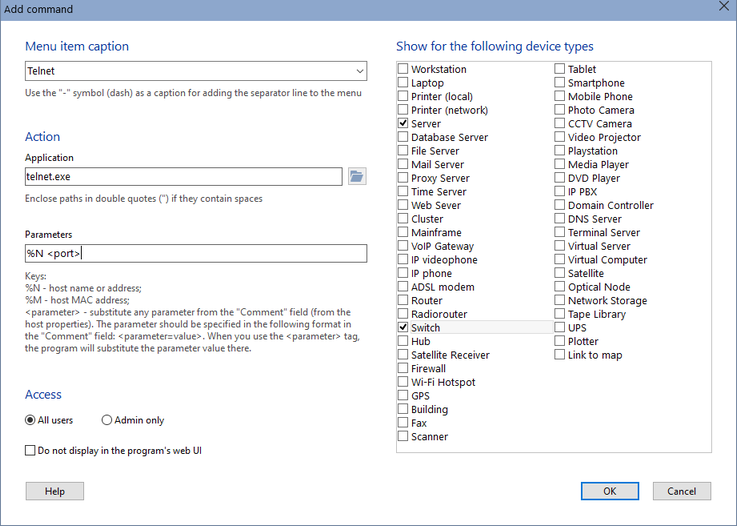
Click the Add button and fill in the form fields:
- Menu title (you can see several templates in the drop-down menu)
- Application path. Specify path for the command executable file. This can be an URL string (starts with http(s)://...) if you want the system to open it.
- Command line parameters. These can be some specific parameters for the command and you can use the substitution keys for substituting the host properties and attributes specified in the host's Comment field. (Specify the attributes in the following format there <parameter=value>. For example, add the <user=admin> string to the host's Comment field to store a user name. After that, you will be able to use the substitution key <user> in the command line parameters and the admin value will be substituted to the command parameters when when you click the menu item. Thus, one command can be used with different parameters for different hosts.)
- User roles for accessing the command. By default, the new menu item will be available for all users using the program. You can hide it for regular users and make available only for administrators with the Operator rights.
- Select device types for which this item will be displayed. This list has a context menu with which you can select all items at once. Using these options, you can create different menus for the server, switch, and video camera, for example.
You can arrange the command order in the menu using the Move up and Move down buttons. Enable the Perform first operation on double click... setting and you will be able to run the most important or popular command with a double click on a device icon on the map. Try this - it's really cool!
When you create an item with the "-" title (minus or dash) and no parameters, this will add a line delimiter to the menu.
Here you can change the program's appearance:
Check list columns
You can hide unnecessary columns of the Check List and rename the existing columns. You can change the column order on the list itself (on the main program window). To do this point a column's header, hold the left mouse button, and drag the column to a place you need in the table.Sort hosts in the tree...
You can choose how to sort hosts in the host list. You can sort hosts by addresses or by captions.Charsets for Unicode support
When you are using the program under Windows which has the default language that differs from English or Russian, it is necessary to select a correct charset for displaying the language's specific symbols correctly. Possibly, you will also need to switch the setting for the default language for software not supporting Unicode in the system. To do this, click the System Language... button, then go to the Administrative tab on the Region system dialog, and click Change system locale....