Contents
How to configure the traffic/bandwidth monitoring in the program?
How to enable NetFlow on a switch?
Configuring and enabling the NetFlow collector in the program
Creating and configuring the "Network traffic (NetFlow v5/9/IPFIX)" check
Viewing statistics, graphs, and diagrams
General information
NetFlow is a networking protocol developed by Cisco Systems for the bandwidth and traffic monitoring. The NetFlow protocol is supported not only by Cisco equipment. Other hardware manufacturers support it too. There are several versions of this protocol available but the most commonly used versions are 5 and 9.
Typically, three components are used in the traffic data collection process with the NetFlow protocol:
- Sensor
It collects the statistics on traffic passing through it. It is usually an L3 switch or a router. Sometimes, standalone sensors receiving the data from a mirrored switch port are used. - Collector
It collects the data from the sensor and places it to the storage. - Analyzer
It analyzes the data collected by the collector and generates or displays human-readable reports (for example, as charts).
Some monitoring systems can combine two components in one like is it done in "10-Strike Network Monitor Pro" program.
The NetFlow protocol operating scheme in the program is displayed on this diagram:
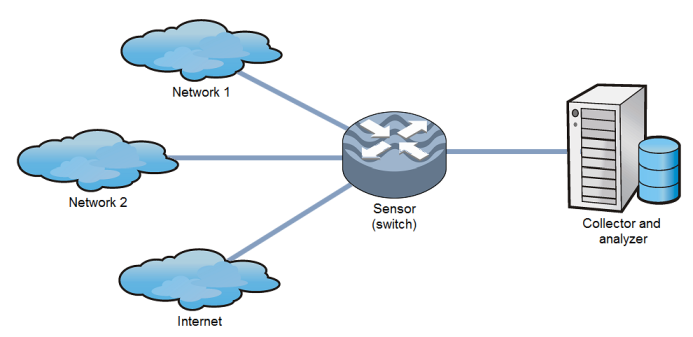
A Sensor (switch) collects the data on the local and Internet traffic passing through it. Then, it sends the data to a host with the IP address specified in the switch settings using the UDP protocol. The monitoring server started on the host receives the data, processes it, and records to the special program's database. This monitoring service also reads the database, counts the traffic volume and bandwidth for a necessary period, and compares it with the specified thresholds during execution of the Bandwidth and traffic (NetFlow v5/9) monitoring check. If current values go beyond thresholds, the program generates alerts and sends notifications.
How to configure the traffic/bandwidth monitoring in the program?
To monitor traffic and bandwidth in the program, perform the following steps:
- Enable collecting and sending the Netflow statistics on your switch or router.
- Configure the collector settings in the program.
- Create the Bandwidth and traffic (NetFlow v5/9) monitoring check in the program and specify its parameters. The collector is activated automatically if there is at least one such check.
- If you need to collect the Netflow statistics without analyzing the speed and volume of traffic in the check, you need to enable the collector in the settings manually.
We will describe each step in details further.
How to enable NetFlow on a switch?
You can enable NetFlow on a switch using the management console and executing a set of special commands. You can find articles describing this process for your specific device on the Internet. The set of commands can vary depending the device model and manufacturer. Please refer to your device's documentation.
Let's see the NetFlow configuration on an example of the CISCO switch:
- Select network interfaces you want to monitor and collect the traffic data on it.
R1(conf)# interface FastEthernet 0/1
R1(config-if)# ip flow ingress
R1(config-if)# ip flow egress
- The second step is specifying the collector address and the receiving UDP port number. In addition, you can specify the NetFlow protocol version compatible with the collector (5 or 9 in our case).
R1(config)# ip flow-export destination 192.168.0.100 2055
R1(config)# ip flow-export version 5
You can use the following commands for testing purposes:
1) show ip cache flow - this displays the local netflow statistics on the switch without the collector.
2) show ip flow export - this displays the statistics on the data exchange with the collector (how many packets were sent, errors occurred, etc.)
Configuring and enabling the NetFlow collector in the program
Common Collector's parameters are located on the NetFlow tab of the program settings.
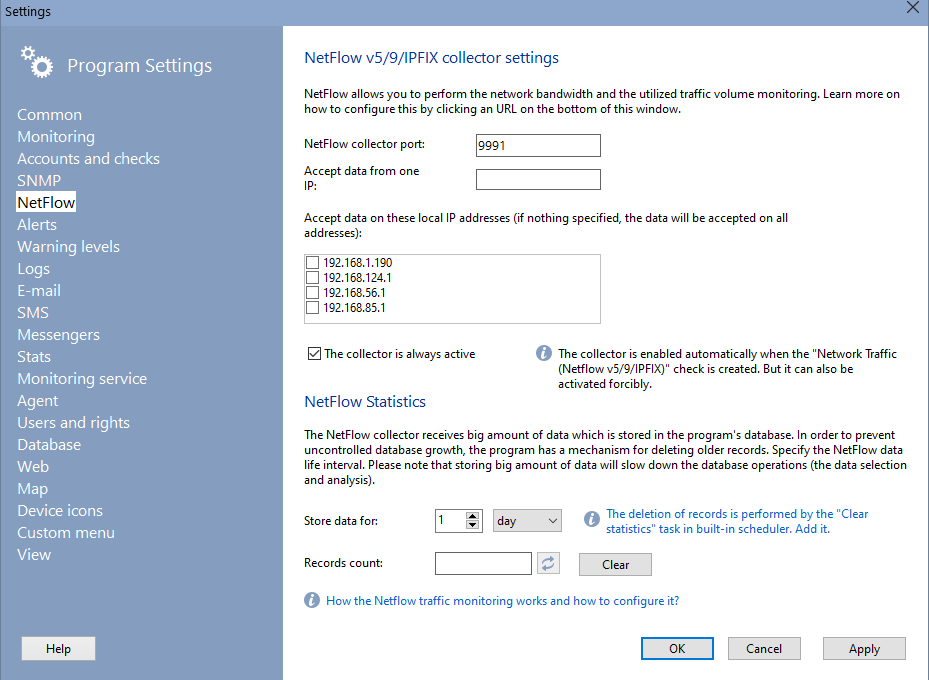
To start collecting the data from your switch, you need to specify the port number which will be used for receiving packets sent by the NetFlow Sensor (your switch). Usually, the 9555, 9995, or 9991 ports are used for this.
If there are several NetFlow data sources on your network and you want to receive the data from only one switch, specify the necessary IP address in the Accept data from one IP field.
If the monitoring server with the monitoring service installed has several network interfaces, you can specify exact local IP addresses should accept the NetFlow data. If nothing is specified in this field, the data will be received on all network interfaces and addresses.
The NetFlow Collector receives big amounts of data and stores it in the program database. To avoid the uncontrolled database growth, the program has got the old database record deletion mechanism. Specify the time period the program should store the NetFlow data in the database in the Store data for field. Please take into consideration that storing big amount of data slows down the data analysis and report creation. By default, the program stores the raw NetFlow data for one month.
There are other settings for specifying the time period of storing the analyzed statistics data in the Statistics section.
Important! The Collector is started automatically and starts receiving and recording the data after the moment you have created at least one monitoring check of the Bandwidth and traffic (NetFlow v5/9) type. If no such checks were created or all these checks were stopped, the Collector will be stopped automatically (on the monitoring service restart).
To enable the collector without creating a Network Traffic (NetFlow v5/9) check, simply enable the Collector is always active setting.
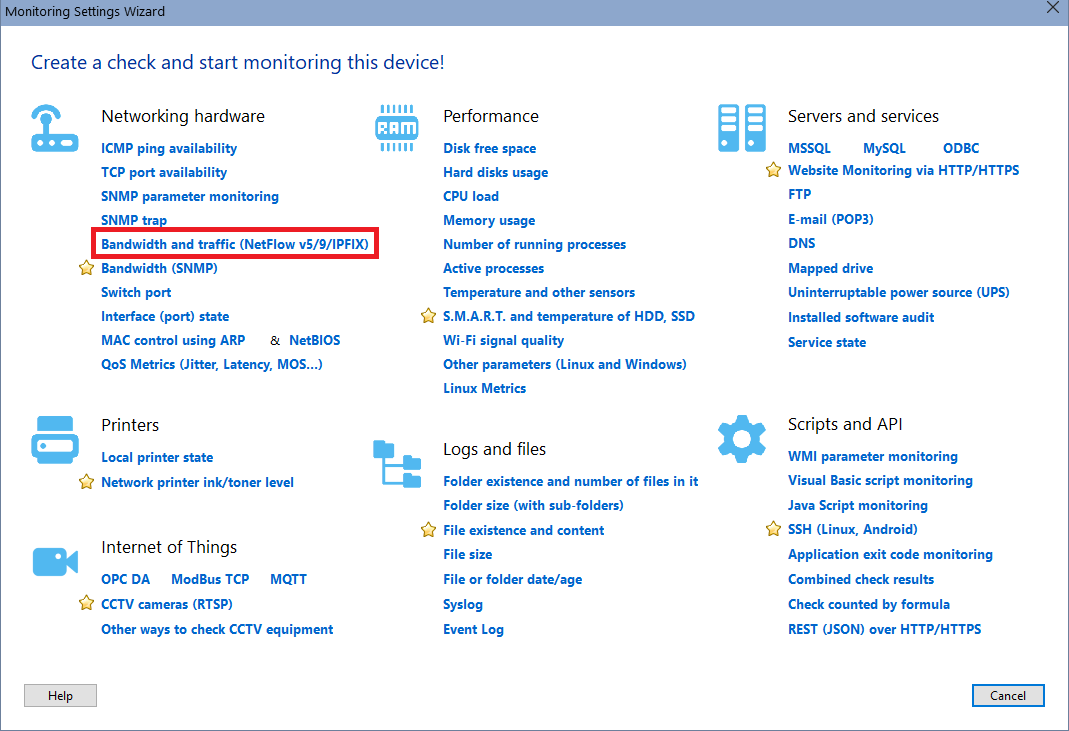
Creating and configuring the "Network traffic (NetFlow v5/9)" monitoring check
In order to start receiving the NetFlow data, you need to create at least one check of the Bandwidth and traffic (NetFlow v5/9) type.
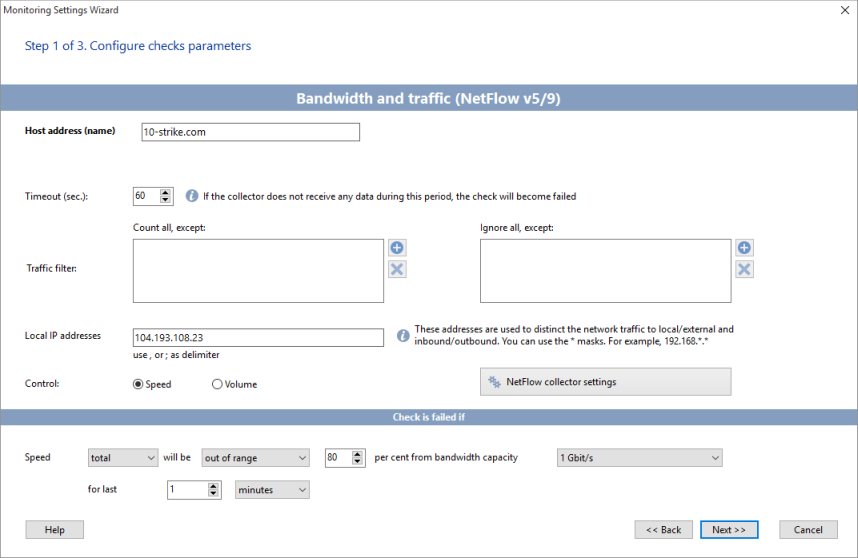
Select a host you want to monitor on the monitoring list and add a new check for it. Select Bandwidth and traffic (NetFlow v5/9).
Specify the new check's parameters.
Host address (filled in automatically). This is the address of the device which traffic you want to monitor.
Timeout (in seconds). If the Collector cannot receive the data during this time, the check will be considered as failed and you will receive the corresponding notification (if you configure the failure alert). The timeout error will mean that the switch stopped collecting and/or sending the data or some network error occurred.
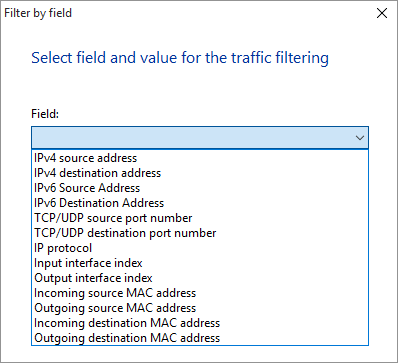
Traffic filter. A Sensor sends the full traffic statistics to the Collector. With filters, it is possible to count some special traffic meeting specified conditions. For example, you can count traffic from certain sources only listing their IP addresses. Or, you can count traffic for one specific protocol (like HTTP, FTP, SMTP,etc.) Create your own rules of the traffic accounting using the Count all, except and Ignore all, except fields.
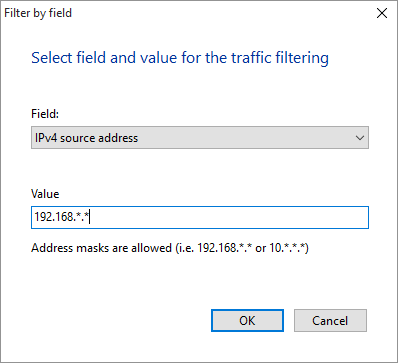
Text values of the filter support the * masks (the * means that any symbol or string can be on this place).
Local IP addresses. This parameter is used for distinction the network traffic to the local/external and inbound/outgoing. Specify the local IP addresses of that host in this field. You can use the '*' masks here (for example, 192.168.*.*).
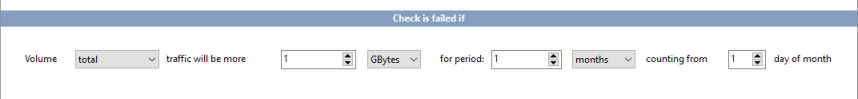
Control: Speed/Volume. Select what you want to monitor: the network speed (per cent of the available bandwidth) or the utilized traffic volume. After selecting the Control option, you can configure the alerting condition (when the check will be considered as successful or failed).
After creating the first check of this type, the Collector will automatically start working. You can check this in the program log (NetMonitorPro.log). A record looking like this should appear:
19.05.2017 14:29:34: Netflow Collector started on port: 9991 (v5.4, svc)
The monitoring server starts analyzing the received data and the program can display charts on the screen after that.
Important! One monitoring server can start only one NetFlow collector. If you want to organize several collectors, use additional monitoring servers. These collectors will add the data to one common table NETFLOW in the program database.
Viewing statistics, graphs, and diagrams
The program allows you to aggregate the Netflow traffic statistics and creates graphs, summary tables, and diagrams. All this is available in the Netflow tab of the main window.
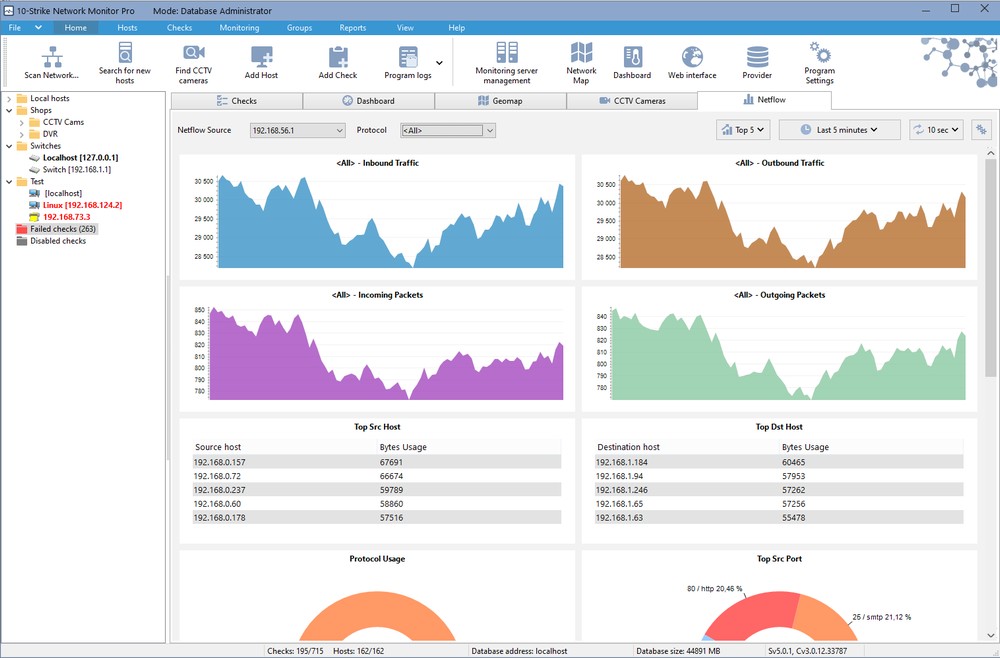
The dashboard presents the following Netflow reports:
- Incoming traffic by protocol
- Outgoing traffic by protocol
- Number of incoming and outgoing packets per second
- Top hosts of outgoing traffic
- Top hosts of incoming traffic
- Protocol usage
- Top outgoing ports
- Top incoming ports
- Top outgoing AS
- Top Incoming AS
The dashboard allows you to switch between the Netflow data sources, change the report update interval, the depth of statistics, and the number of points in the ratings.