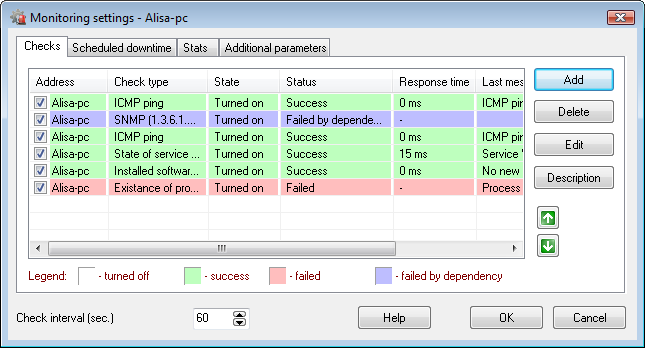
In the program, each network device has a list of different monitoring checks. You can display this window by selecting a device icon and pressing Ctrl+F2.
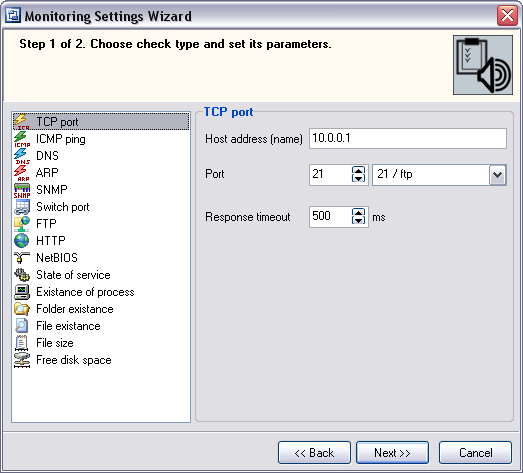
When adding a new check, you select its type and set the check's parameters. The upcoming versions of the program will have new check types on the regular basis.
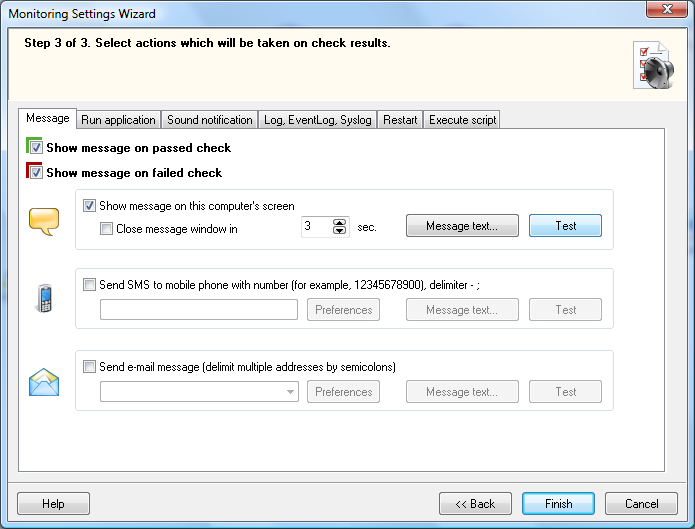
Then you set up program's response on failed or successful monitoring results. LANState can show screen notification, play a sound, run a program, write to log, send e-mail, etc.
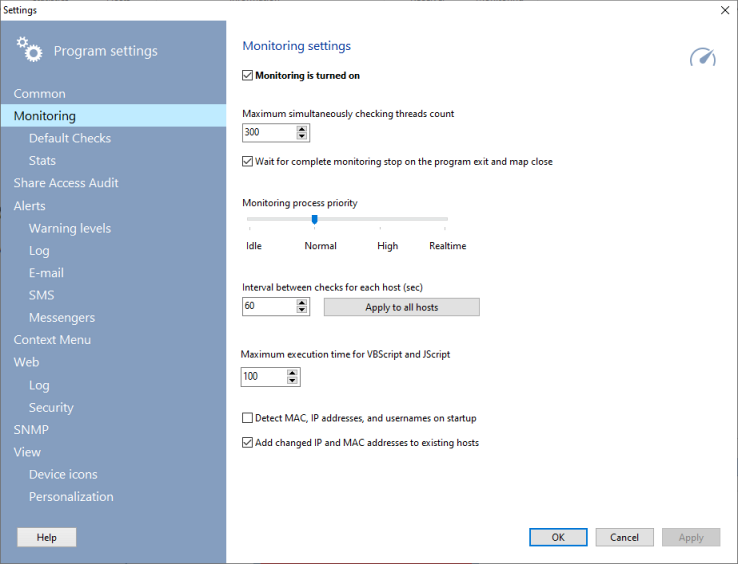
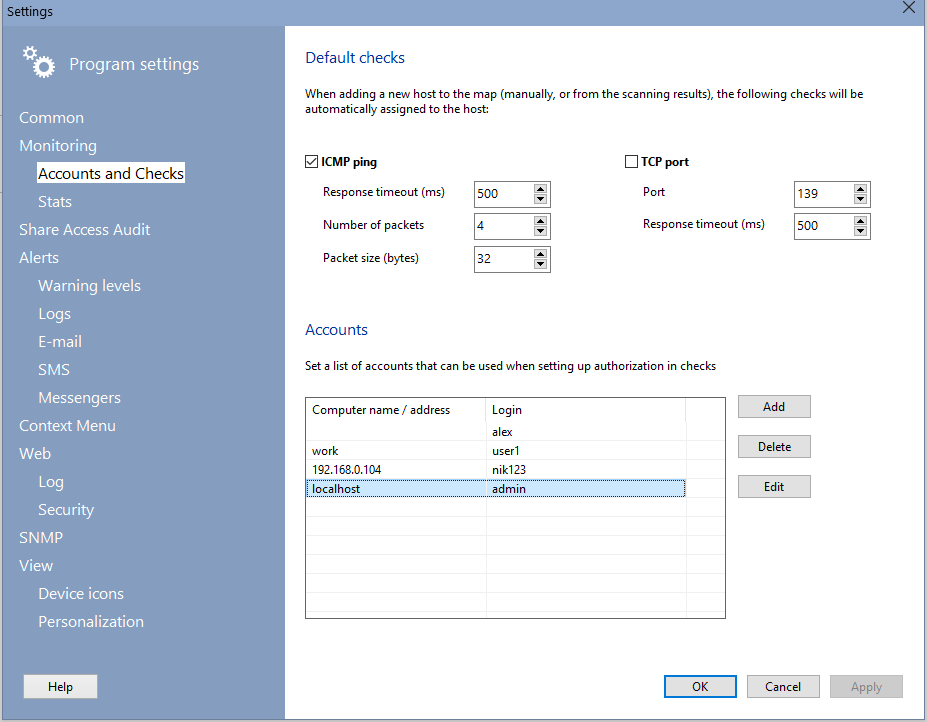
There are two types of default checks (ICMP and TCP) which are assigned to newly added host automatically, easing up network monitoring setup. You can reassign some monitoring parameters (checking interval, timeouts, number of ICMP packets, TCP port) for all network devices on map simultaneously.
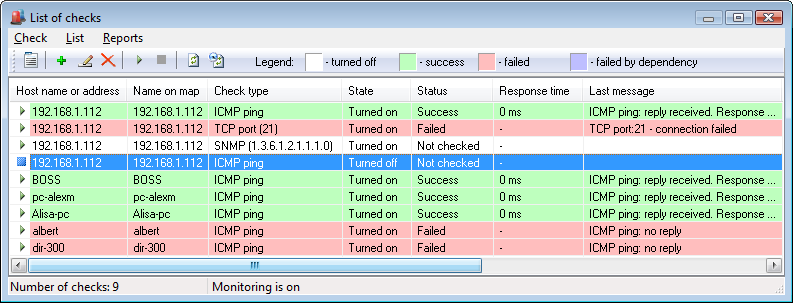
The program can show all devices' monitoring checks in one list. You can display this window by pressing F2 in the program.
10-Strike LANState Pro supports the web UI. You can enable it and access the program remotely using a web browser (even on mobile devices). You can watch the list of checks and results, watch the response time and downtime diagrams online.
