 Nowadays, losing important data may be more disastrous than losing a tangible asset. In some cases, a business may collapse due to a loss of vital data. A problem like that is usually caused by a sudden failure of storage media. Such failures are not always sudden. Hard disk drives usually fail due to slow degradation of their mechanical parts and magnetic platters. Just like a person, a hard drive may feel unwell for a long time before it eventually fails. System administrators must watch for the signs of a hard drives imminent failure so that they can replace it in good time after copying valuable data to healthy storage media.
Article Navigation
- Methods for the Drive State and Health Diagnostics
- How to Configure the HDD/SSD Health and State Monitoring
- SMART HDD Monitoring and Important Attributes
- NVMe SSD Monitoring and Major Drive Health Attributes
- SATA SSD Monitoring and Major Drive Health Attributes
- Displaying Widgets with SSD Monitoring Check Results on Graphic Map
- Video Review
- Conclusion
Methods for the Drive State and Health Diagnostics
Thankfully, hard drives are capable of self-diagnostics. That capability is called S.M.A.R.T. (Self-Monitoring, Analysis, and Reporting Technology). The early hard drive self-diagnostics standards were jointly developed by major hard drive vendors back in 1995. Since then, the S.M.A.R.T. technology has been improved a lot. Each hard drive vendor defines a set of the S.M.A.R.T. Attributes it deems to be important. If you monitor these, you can improve the overall system reliability. When a hard drive is turned on, it starts automatically checking and updating its S.M.A.R.T. attributes. Attribute values are stored in a special disk area that can only be accessed by the hard drives firmware. Each hard drive vendor also sets threshold values that should not be normally passed.
Among other things, each system administrator must regularly check critical SMART attributes and make sure that they stay within safe limits. There are special applications that can read SMART attributes and display them in a user-friendly format. But when you are overwhelmed by routine work, its easy to forget about checking the hard drive health attributes and miss the onset of a critical situation, such as an
- critical temperature
- exponential increasing of read/write errors
- seek errors
- reallocated sectors
That's why we recommend that you use a monitoring system that can automatically check SMART attributes in the 24/7 mode and immediately notify you about any abnormal situation.
SSD (and SSD NVMe) drives provide a bit different set of monitoring parameters. The difference from HDD is that an SSD does not reallocate sectors. It cannot have any surface problems. The major SSD health parameter is the lifespan status. The number of total writing operations is limited for the SSD disk life. So you need to check the SSD usage status and control whether the lifespan percentage count is under the allowed threshold.
You can monitor the following health parameters on SSD:
- available spare
- percentage used
- temperature
- reads/writes
- error counts
- critical warning (read-only mode, etc.)
How to Configure the HDD/SSD Health and State Monitoring
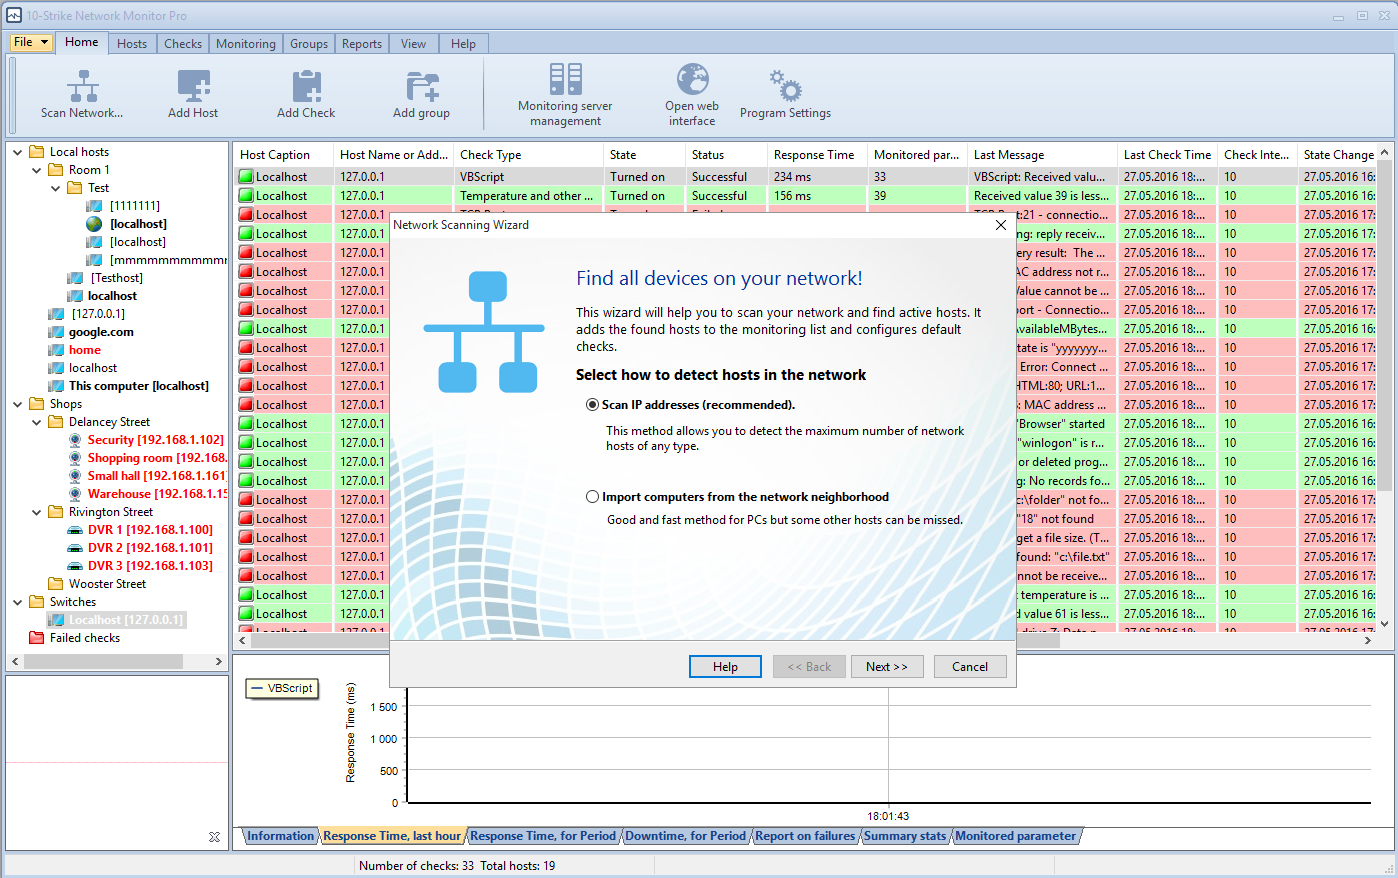
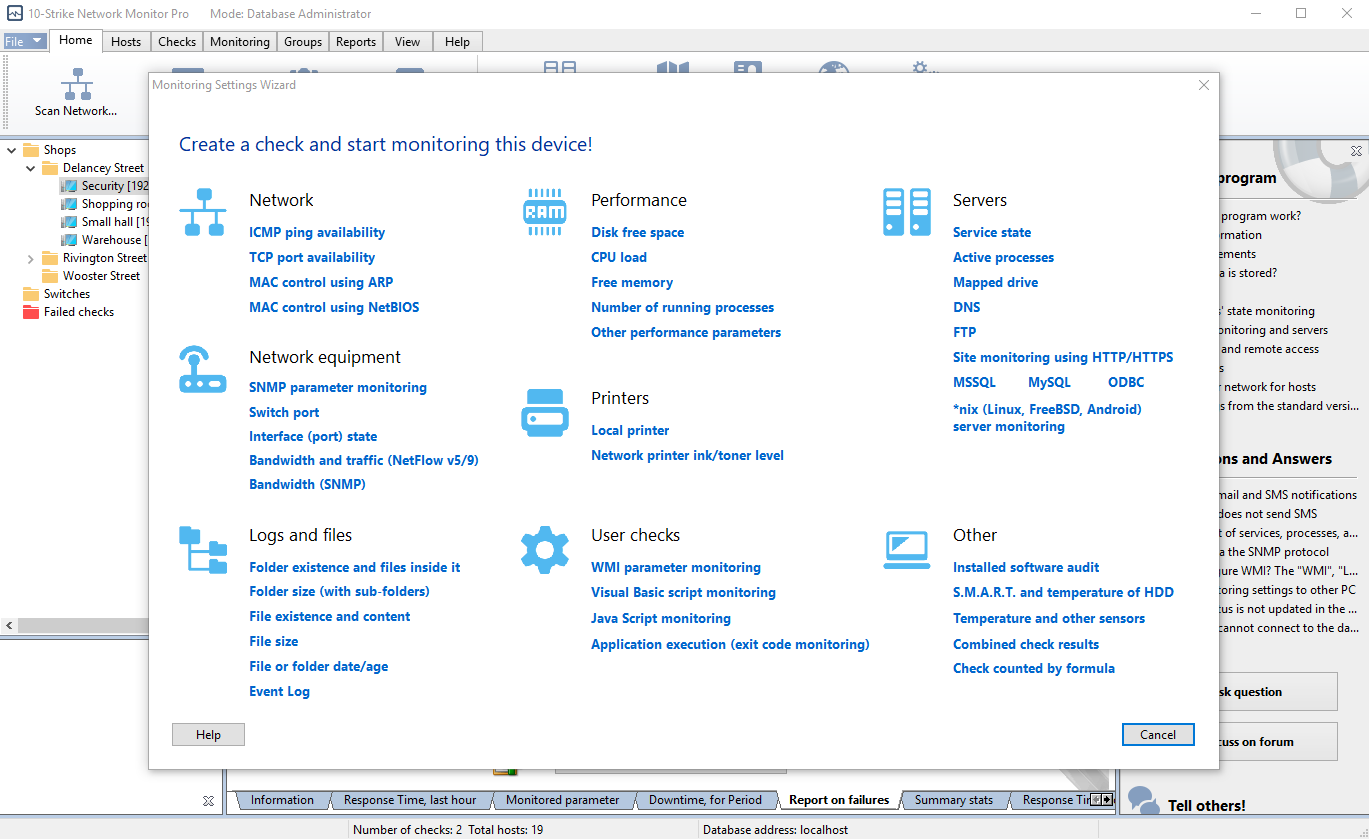
10-Strike Network Monitor Pro is a multi-purpose software product that can monitor many different things, including SMART attributes for HDD, SSD, and NVMe drives. You need to install it on one of your servers, and then install its agents on the computers whose hard drives you want to monitor. After that, Network Monitor will scan the network, find any available hosts, and add them to the monitoring list. Then you need to create the check called S.M.A.R.T. for the hosts with the agent installed on, and it will run at regular intervals. The time interval can be in the range from a few seconds to several hours. The monitoring core will analyze the values received from each agent and compare them with the threshold values. If the threshold is passed, Network Monitor can notify you about that by sending an SMS text message, email message, etc.
It is easy to create a S.M.A.R.T. check to monitor hard drive health attributes. You need to do the following:
• Install 10-Strike Network Monitor Pro.
• Install Network Monitors agent on each host whose hard drive you want to monitor. The agent is a Windows service that will read S.M.A.R.T. attributes and send them to the monitoring core.
• Launch Network Monitor and run a network scan, or manually add the hosts.
• Select the host in the tree (at the left) and then select Add check in its context menu.
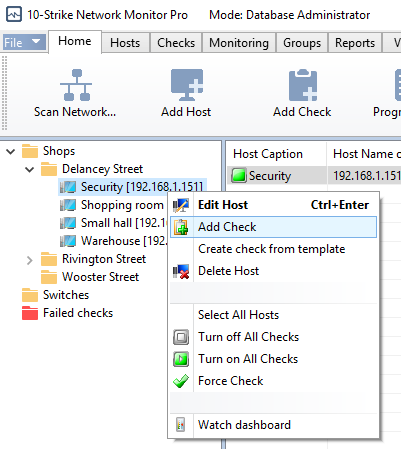
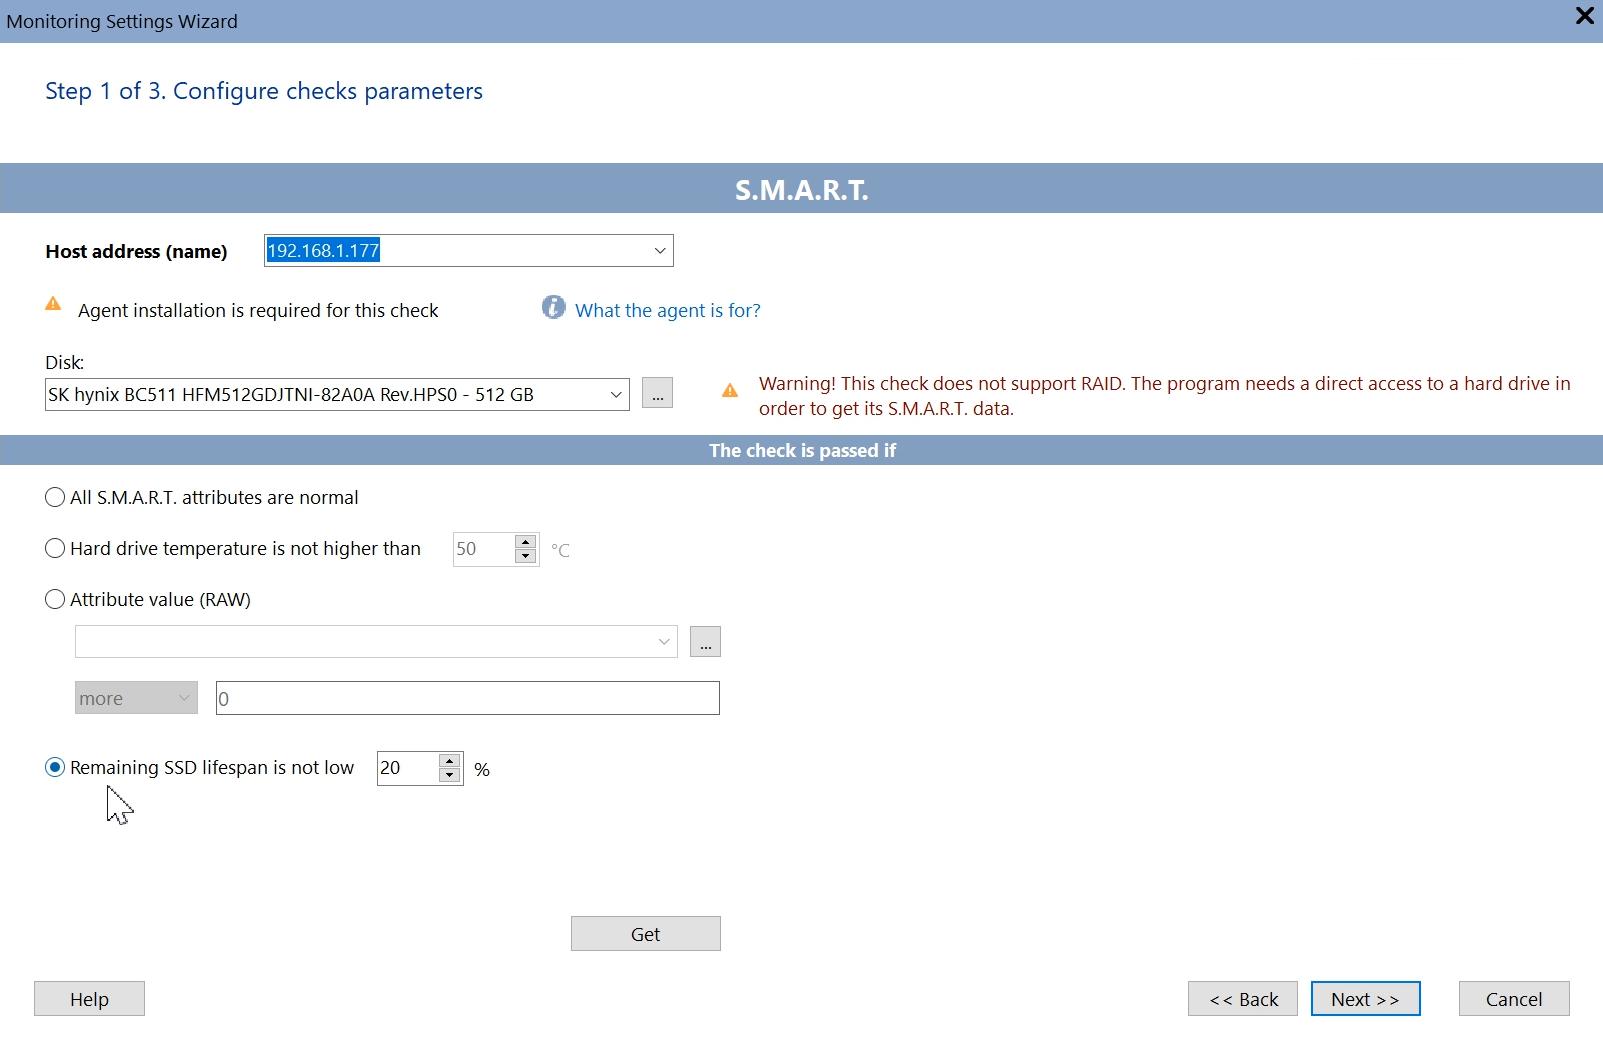
• In the Check parameters dialog box, select the check type (S.M.A.R.T.). After that, click the button to the right of the Hard drive drop-down list, and then select a hard drive or SSD in the list.
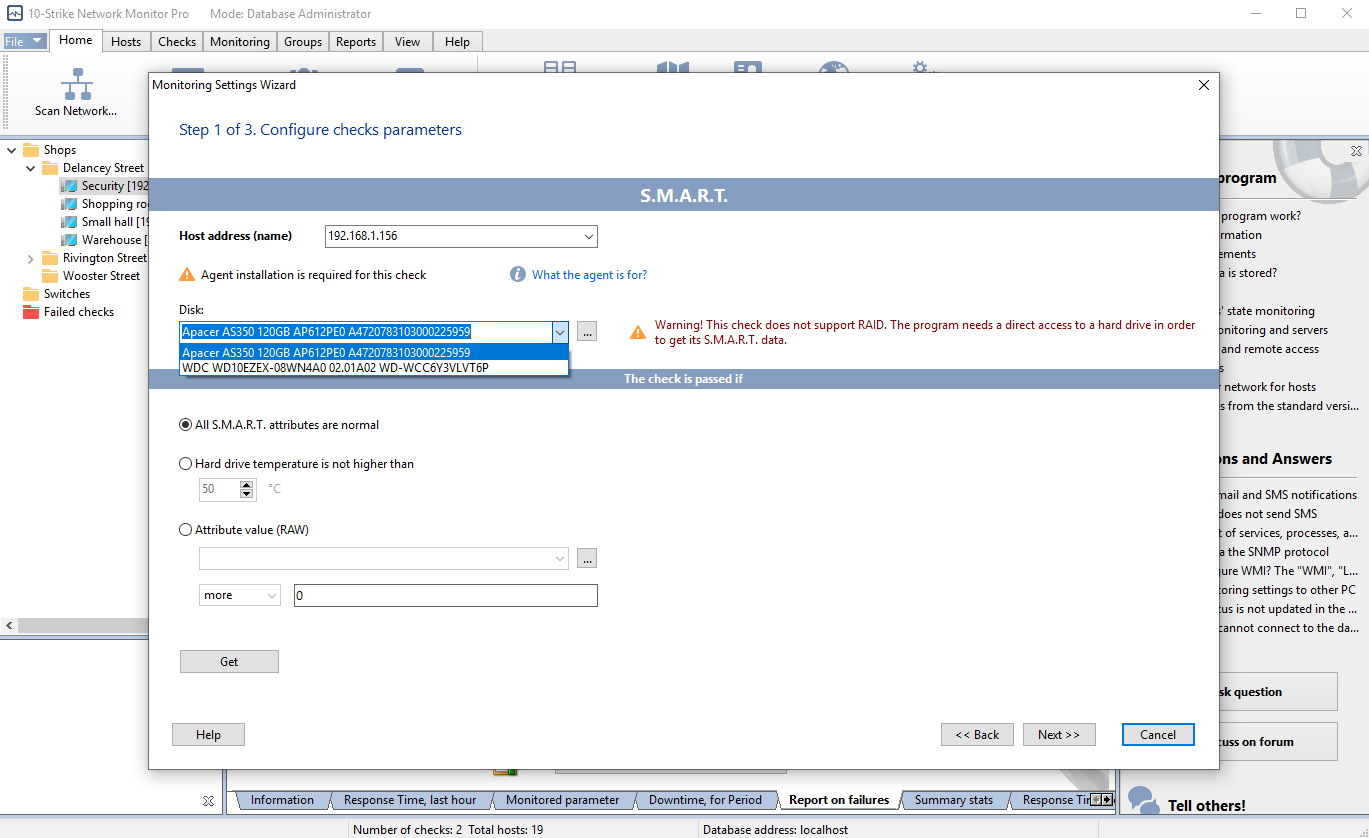
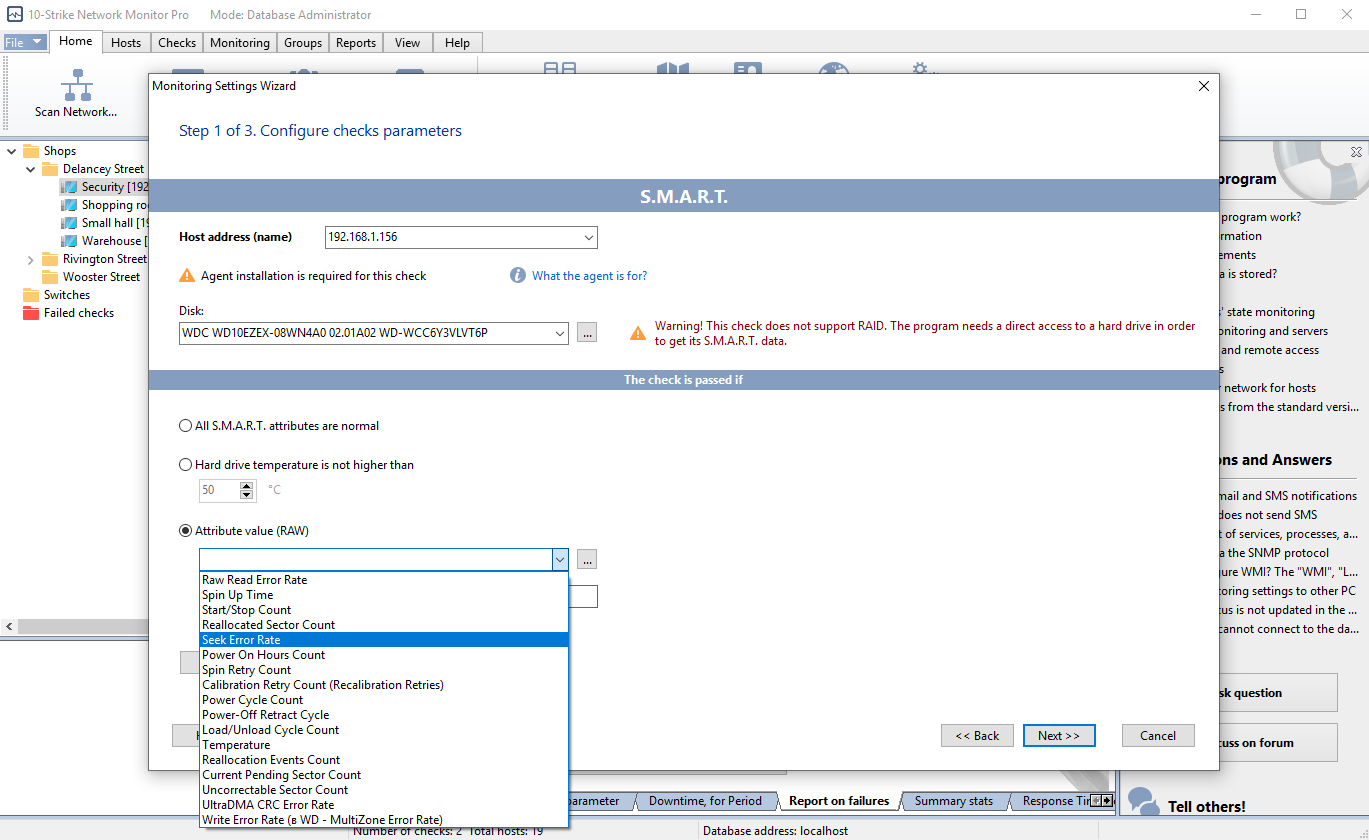
• Select the S.M.A.R.T. attribute that you want to monitor (for example, Temperature or Seek Error Rate). To do that, click the button to the right of the Attribute value (RAW) drop-down list, and then select its name in the list.
• Set the alarm triggering conditions (for example, The check is successful if the attribute value is less than 50).
• Set the check start parameters or keep the default ones. Set the notification options, and save the changes.
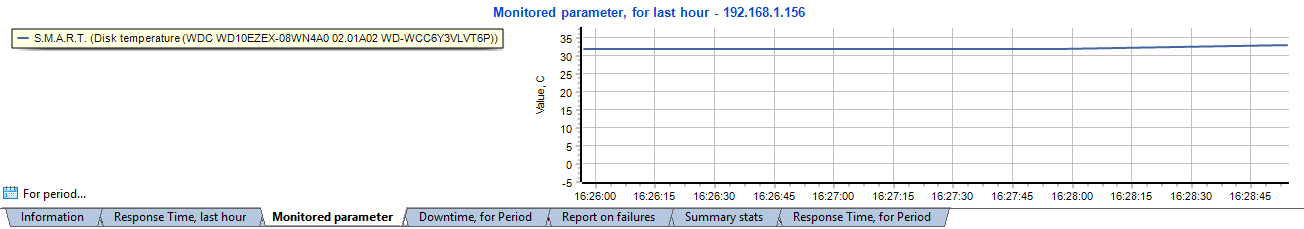
As soon as you add a new check, it will start collecting data. You can watch the data collection process by switching to the Monitored parameter tab (click the tab at the bottom of the window). Network Monitor will display a graph of the S.M.A.R.T. attribute you selected.
SMART HDD Monitoring and Important Attributes
Below you can find a list of the most important S.M.A.R.T. attributes that you can monitor on HDD. Note that the choice of attributes depends on the storage media. A solid-state drive (SSD) will not provide the same set of S.M.A.R.T. attributes as a hard drive does.
· #01 Raw Read Error Rate The rate of hardware read errors that occurred when reading data from the magnetic platter.
· #03 Spin-Up Time The average spindle spin-up time. An increase of the value indicates mechanical wear (for example, increased friction in the bearing) or inadequate power supply (for example, the voltage drops each time the spindle starts to spin up).
· #05 Reallocated Sectors Count This attribute represents the number of bad sectors that have been automatically reallocated by the hard drives firmware. Each time a read/write error is detected, the firmware marks the sector as remapped and transfers data from it to the reserved area. The raw value is the total number of reallocated sectors. The higher the value, the worse the condition of the platter surface.
· #07 Seek Error Rate The rate of seek errors of the magnetic heads. An increase of the value indicates a poor condition of the platter surface or a partial failure in the mechanical positioning system. It may also be caused by overheating or external vibration (for example, from other hard drives in that computer).
· #10 Spin-Up Retry Count The number of repeated spin-up attempts. An increase of the value indicates a problem in the hard drives mechanical subsystem.
· #196 Reallocation Event Count The number of remapping operations. This attribute represents the total number of attempts to transfer data from bad sectors to the reserved area (which is usually small, just several thousand sectors). Both successful and unsuccessful attempts are counted.
· #197 Current Pending Sector Count The number of unstable sectors that have to be remapped due to unrecoverable read errors. These sectors have not been marked as bad yet, but reading data from them is unreliable (for example, it may take a few attempts). Later on, if an unstable sector is read successfully, it will be marked as good; otherwise, the hard drives firmware will try to remap it.
· #198 Uncorrectable Sector Count The total number of sectors that cannot be read from or written to. An increase of the value indicates major defects of the magnetic platter surface or problems in the mechanical subsystem.
· #220 Disk Shift The distance the magnetic platters have shifted relative to the spindle. This problem is mostly caused by a mechanical shock. A major increase of the value means the hard drive is unusable.
NVMe SSD Monitoring and Major Drive Health Attributes
The S.M.A.R.T. parameter set for NVMe SSDs is different from ATA drives. In most cases, this is a set of ready-made indicators, without specifying thresholds and worst-case values. Here is an example of SMART Attributes for a WD Blue SN500 M.2 SSD:
critical_warning: 0
temperature: 39
available_spare: 100
available_spare_threshold: 10
percentage_used: 1
data_units_read: 13733602
data_units_written: 14396473
host_reads: 365745477
host_writes: 391133456
controller_busy_time: 836
power_cycles: 1419
power_on_hours: 4612
unsafe_shutdowns: 13
media_errors: 0
num_err_log_entries: 1
warning_temp_time: 0
critical_comp_time: 0
Among these parameters, the most interesting are the following ones:
critical_warning
Parameter indicating the state of the disk:
- value 0 - Disk is okay
- bit 0 (1) - Available spare is below threshold
- bit 1 (2) - Temperature has exceeded threshold
- bit 2 (4) - Reliability is degraded due to excessive media or internal errors
- bit 3 (8) - Media is placed in Read-Only mode
- bit 4 (16) - Volatile memory backup system has failed
temperature
Overall Device current temperature (please note that this might be in Kelvin). Constant overheating of the SSD can lead to its rapid failure, therefore it is necessary to monitor this parameter.
percentage_used
Percentage of SSD lifespan consumed. As soon as this parameter reaches 100%, it will mean that the life cycle of the SSD is completed and the disk will go into the read-only mode (locked). This is a very important parameter that needs monitoring. The task of the administrator is to track disks in advance and replace SSDs with the little remaining resource.
media_errors
The number of times the controller encountered a fatal data integrity error. If the value of this parameter is constantly growing, you should consider replacing the SSD with a new one.
num_err_log_entries
The number of error log entries over the lifetime of the controller. As in the previous case, you should pay attention to the growth of this parameter.
You can easily monitor the percentage_used parameter that corresponds to the NVMe SSD lifespan as well as other parameters using 10-Strike Network Monitor Pro.
SATA SSD Monitoring and Major Disk Health Attributes for SATA SSD Drives
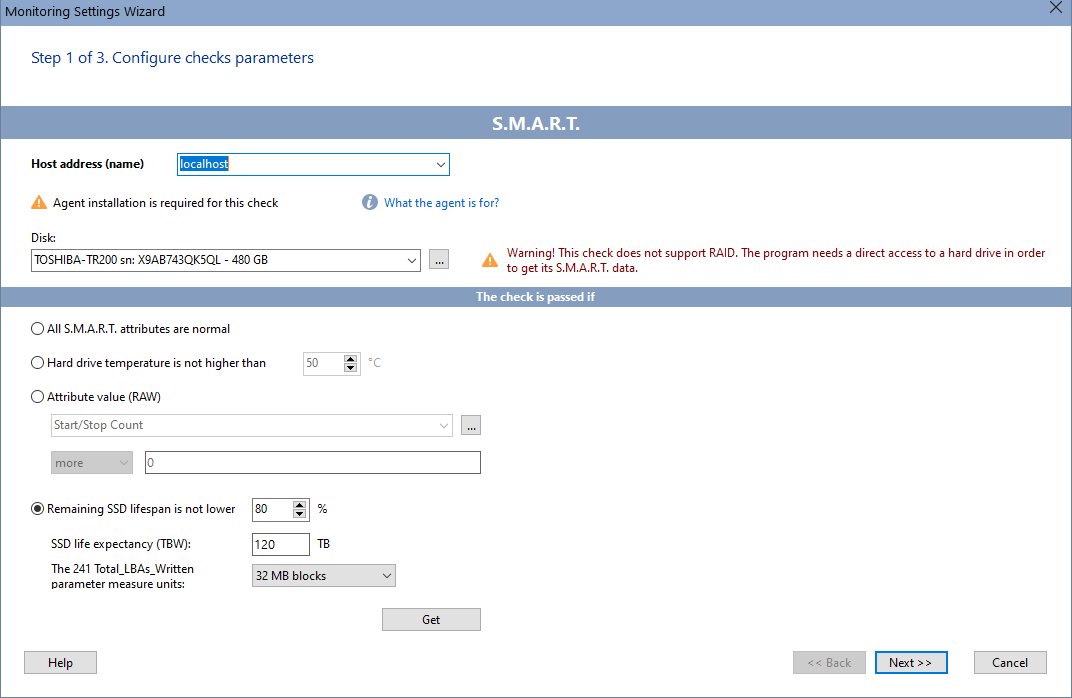
The health of pre-NVMe SSDs can also be monitored. Such disks can display values of the indicator such as "the total number of LBA sectors written" (Total LBA Written). This counter shows how many 512-byte sectors were written to the disk over the entire history of its operation. The following options are possible:
241 - Total LBA Written - the total number of 512-byte sectors written over the entire life of the device.
or
175 - Host_Writes_MiB - how many MiBs (Millions of Bytes) were written to disk.
You can find the threshold value for disk write volume over its endurance lifespan in the documentation for the SSD on the manufacturer's website or in the instructions. It is usually measured in terabytes (TB) or recorded terabytes (TB Written or TBW). Typical values for modern drives range from 40 (for the 5-10-year-old models) to several hundred TB (for modern disks).
You can monitor all these SSD SMART parameters and attributes using our program (and the instructions placed above), set critical value thresholds for your disks, so the program will notify you when the monitored values go beyond the thresholds. You can also visually observe the current values of the recorded volumes as a percentage of the allowed maximum on graphic rectangular indicators (progress bars).
You can also check for other attributes, such as error growth. You will see the set of parameters received from the disk in the SMART-check settings window in the program.
You can easily set up the TBW SSD monitoring using 10-Strike Network Monitor Pro.
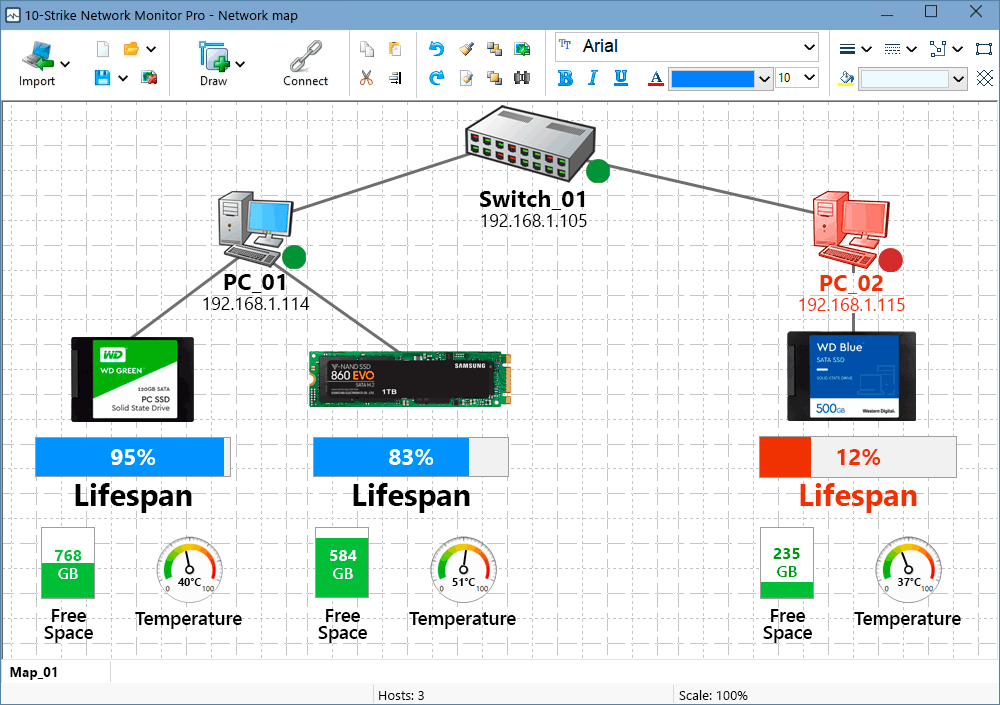
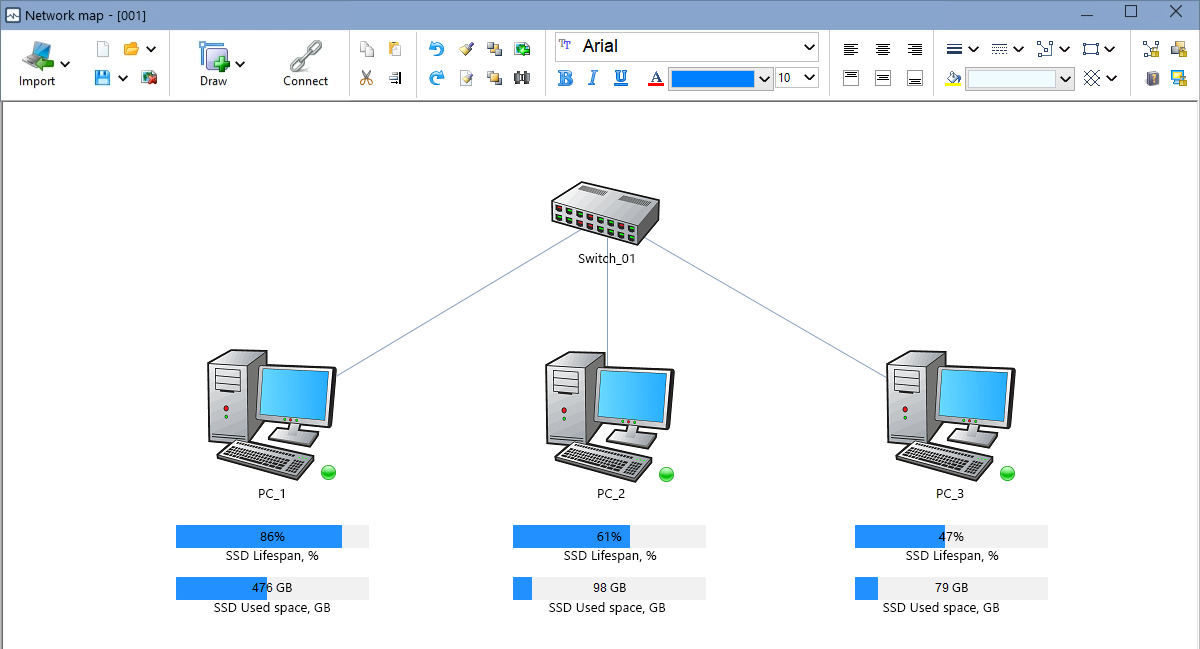
Displaying Widgets with SSD Monitoring Check Results on Graphic Map
You can also watch the SSD monitoring results on a graphic map using widgets and indicators (bars and gauges). You can display remaining or used lifespan, temperature, free disk space, etc.
Video Review
We have created a short video for explaining the SSD SMART monitoring concept. You can also watch it.
Conclusion
The S.M.A.R.T. attribute monitoring is not the silver bullet. The S.M.A.R.T. technology is mostly intended to help you notice a deterioration of critical hard drive parameters in good time so that you can replace the failing storage media before a data loss occurs. But if you back up your data regularly and monitor your hard drives (or SSD's) S.M.A.R.T. attributes, you can minimize your data loss risks and avoid the huge data recovery costs. Keep in mind this rule: Good S.M.A.R.T. attributes do not guarantee that the hard drive is healthy, but poor ones are usually a telltale sign of a problem.
For testing the performance issues in your specific environment, we recommend you to download and try our fully functional free 30-day trial version.
Our Clients