10-Strike Network Monitor Pro is a distributed network monitoring software system for Windows. It can be used for the device and service monitoring on remote networks that are spread over the world and behind firewalls, routers, etc. You can see some screenshots of the program on this page.
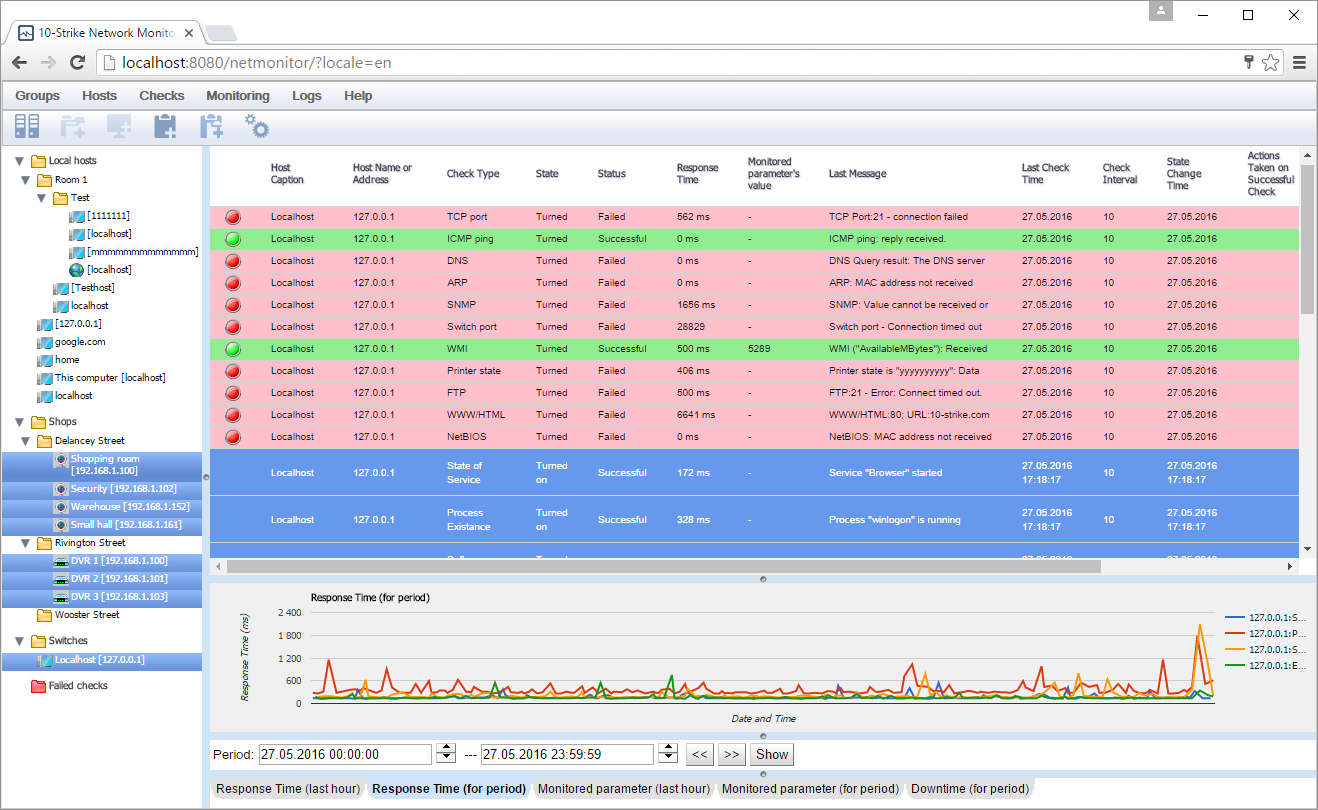
The main program window:

Failed monitoring checks are marked by red color. Successful checks are green.
You can configure alerts and actions for various events so the program can even fix the problem istead of just notifying you.
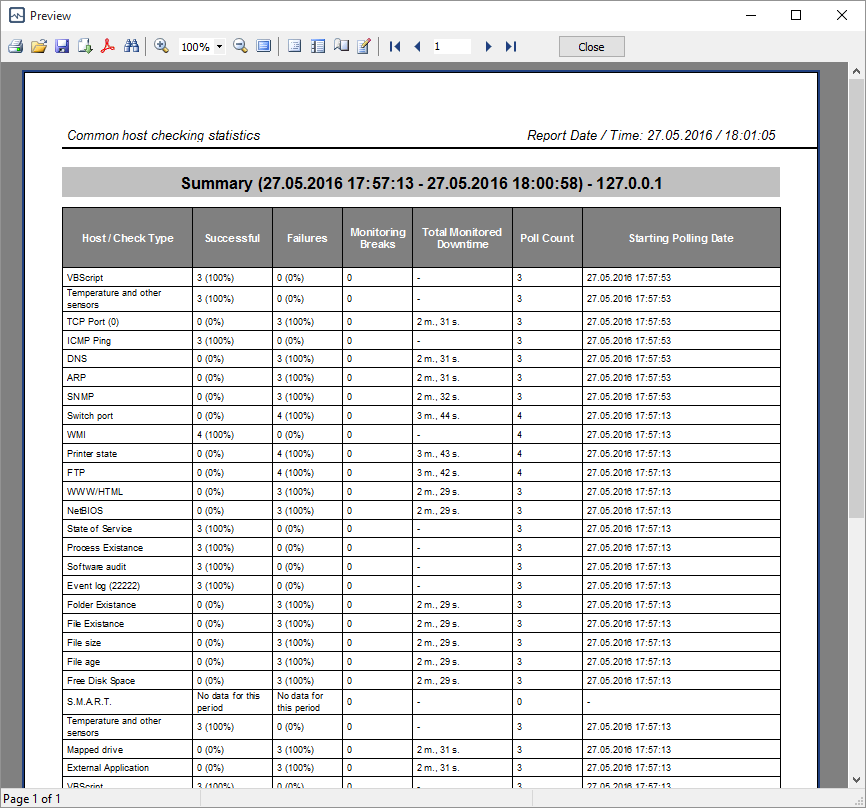
The program stores the monitoring statistics and draws diagrams with the response time's or the monitored parameter's history. You can save them as reports or print:

See when the response time of your services was high and when the connection was broken. The higher response time you get, the higher the network device bandwidth load is. For example, such statistics can help you to find out the days of the week when your servers or network have the highest load. Analyze the response time data and be ready to possible overloads and prevent the server outage.
If you monitor not only the service availability but some parameter on your managed switch or UPS (via SNMP), or on a PC (via WMI), you will see how this parameter was changing in time on the diagram. This can be a temperature, voltage, free space, ping, bandwidth, or any other parameter you need.
You can also see the device state immediately on graphic network maps with vector device icons and widgets in real time.

Network bandwidth monitoring configuration:

HTTP(S) web server monitoring:

Netflow traffic and bandwidth monitoring:

Computer CPU-GPU temperature and fan speed monitoring:

Network printer monitoring (ink or toner level):

CCTV camera bandwidth monitoring using RTSP:

CCTV camera or DVR (NVR) monitoring:

SMART disk health and temperature monitoring (HDD and SSD):

SSD lifespan monitoring and displaying the health parameters on the graphic network map widgets:

SNMP device monitoring - you can select OIDs in the MIB browser:

SQL database server monitoring:

Switch port bandwidth monitoring:

Switch configuration file change monitoring:

SNMP trap monitoring:

SNMP trap message configuration:

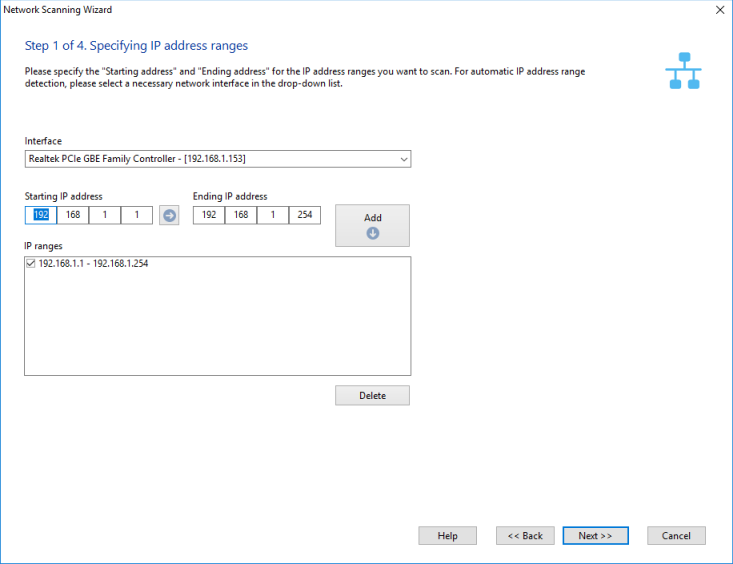
Initial network scanning. Enter IP address ranges for searching hosts:
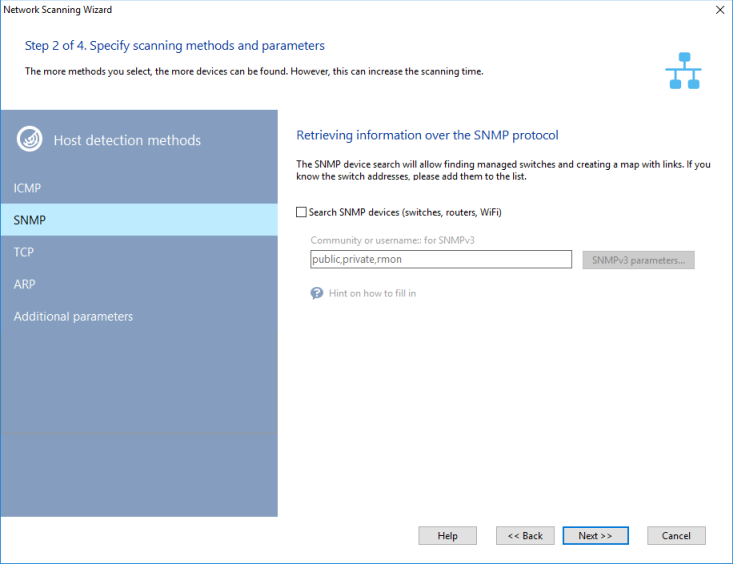
Select network scanning methods and configure scanning parameters:
Select devices from the scanning results:
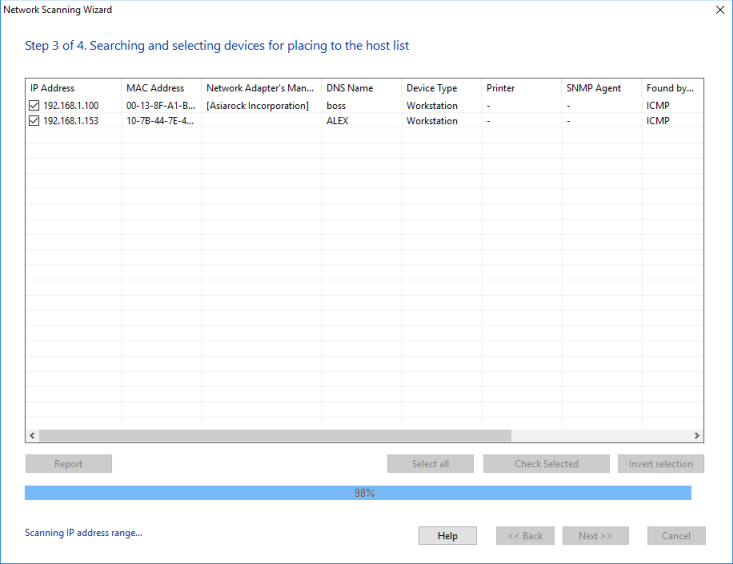
ICMP ping checks will be added automatically to new hosts.
Creating reports:
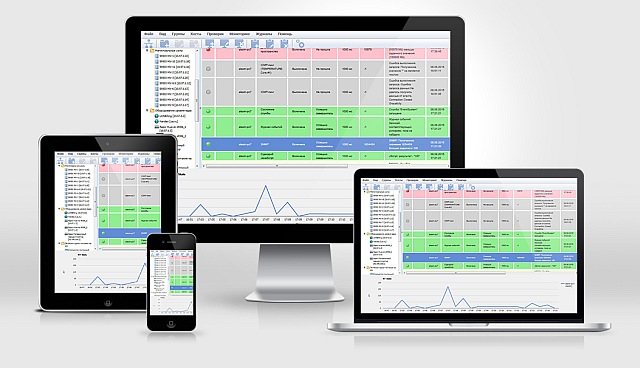
Web UI
The distributed monitoring system can be fully managed remotely via the web interface:
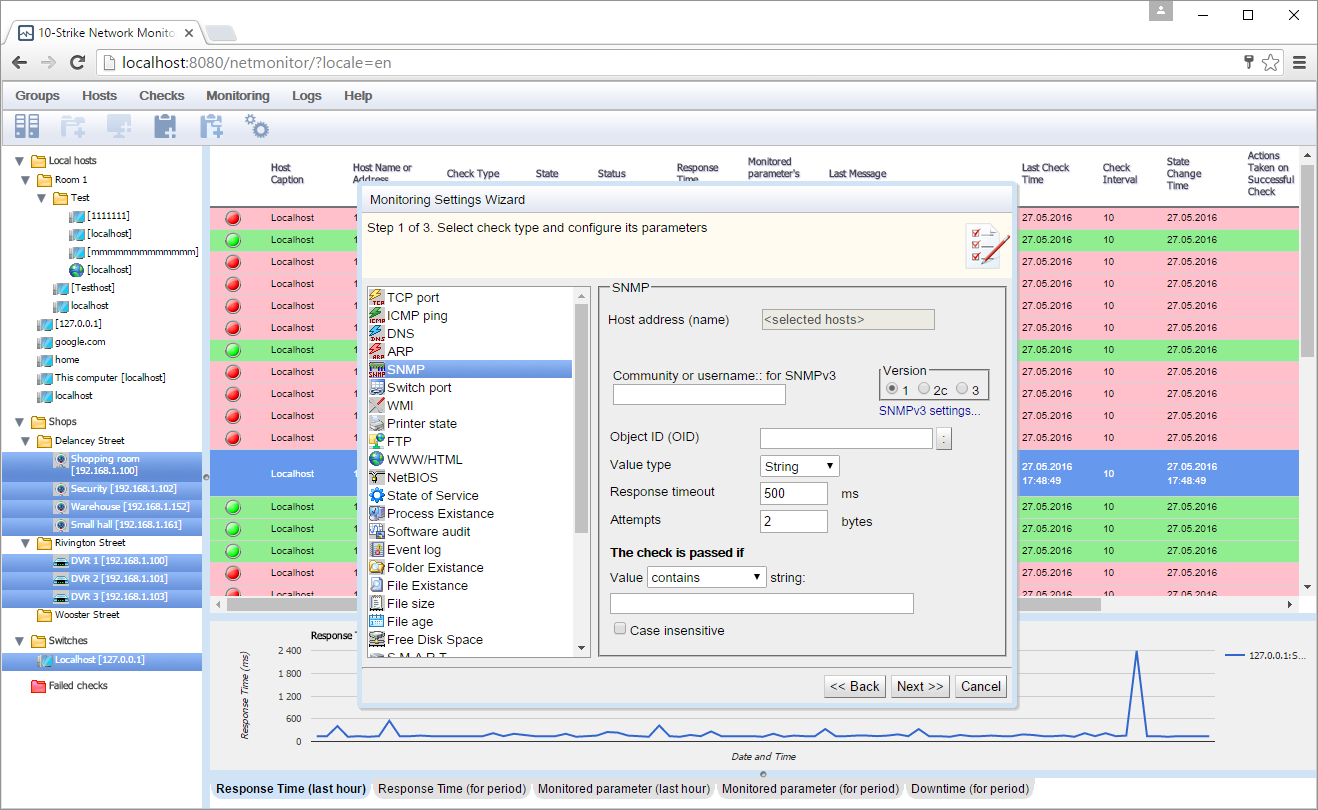
SNMP monitoring check configuration via the web UI:
Watching downtime:
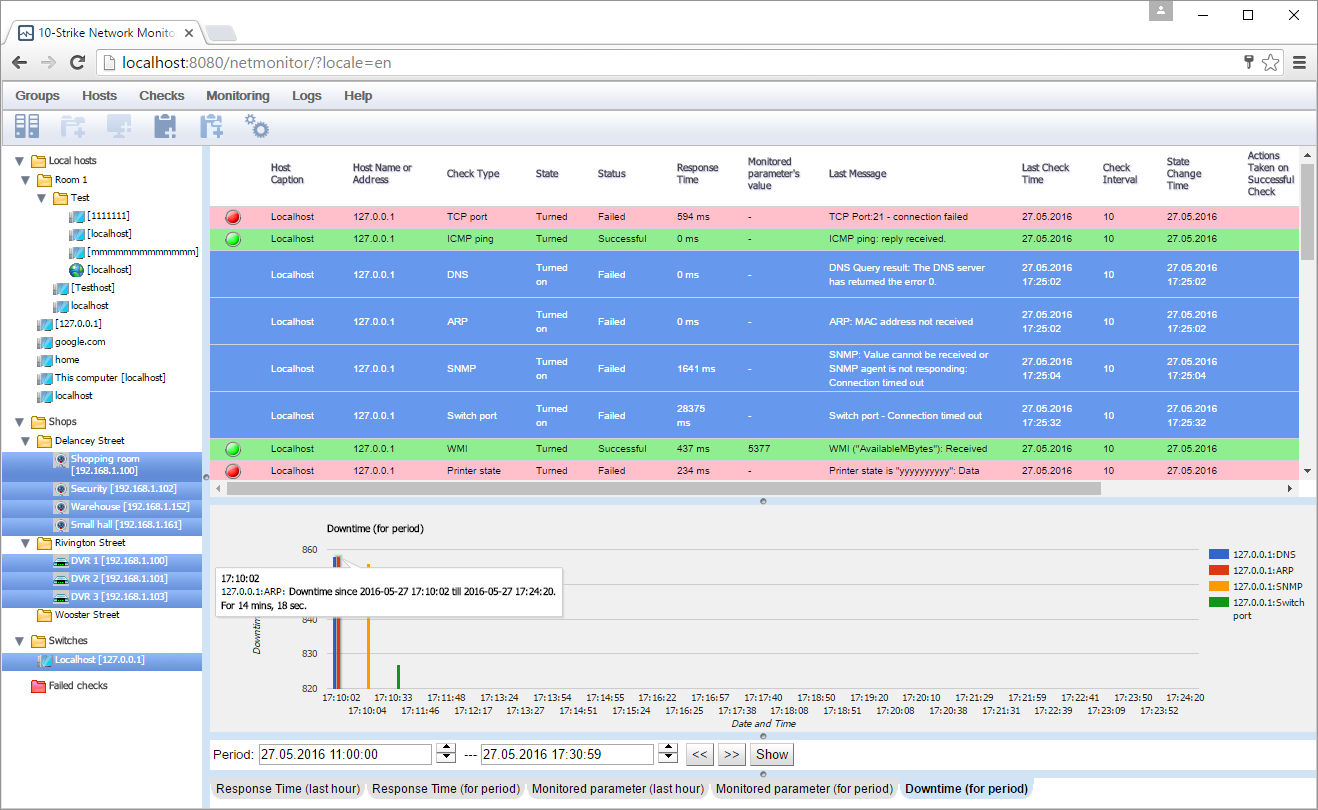
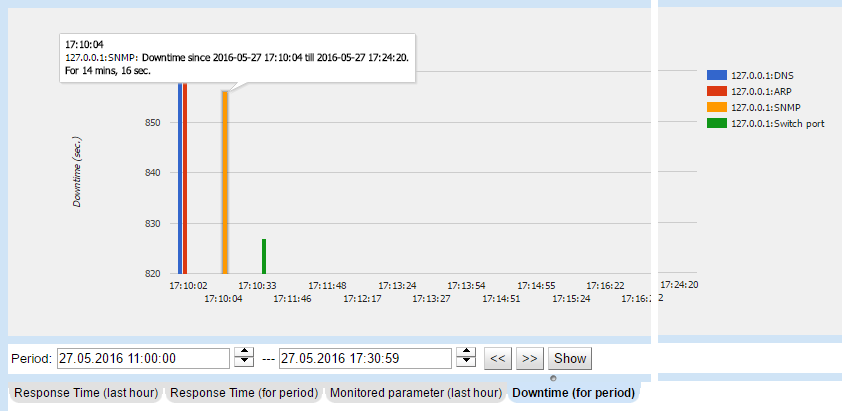
The downtime diagram:
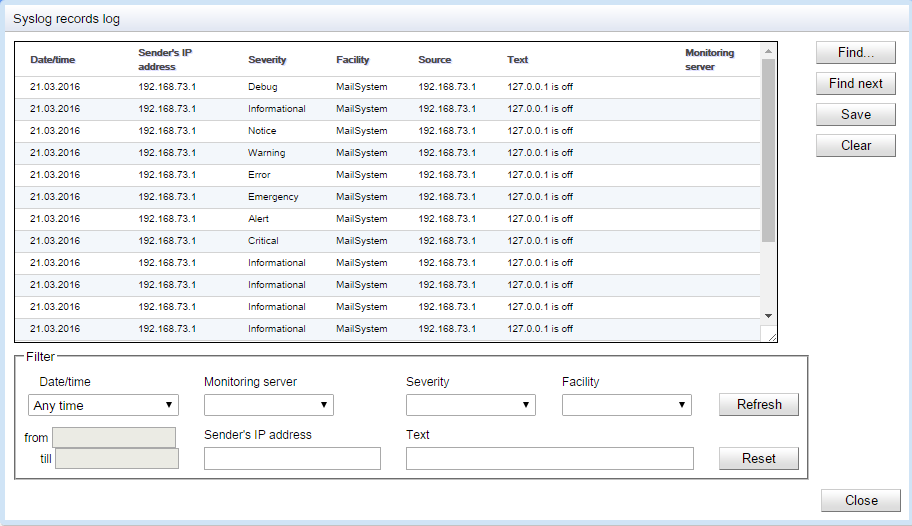
Watching Syslog through the web UI:
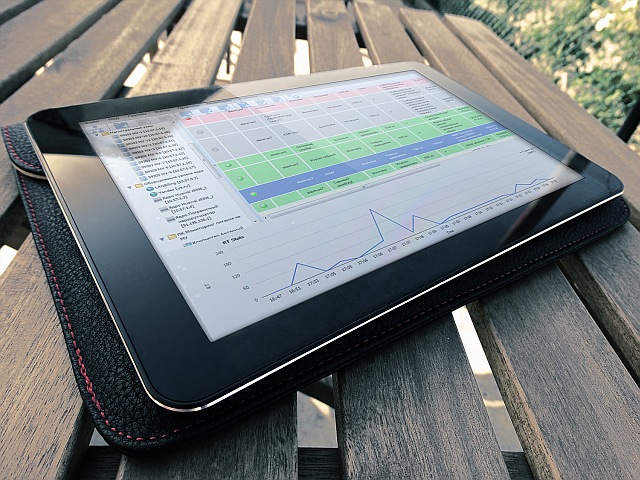
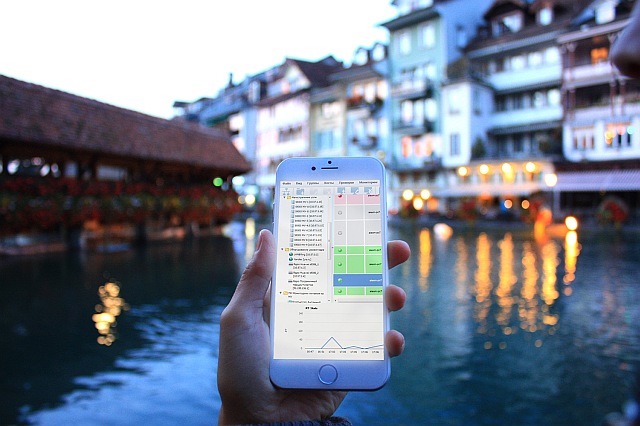
The web UI can be accessed from mobile devices as well:
![]() 10-Strike Network Monitor Pro can execute the following network monitoring checks in order to monitor network devices and servers:
10-Strike Network Monitor Pro can execute the following network monitoring checks in order to monitor network devices and servers:
- TCP port monitoring
- ICMP ping monitoring
- DNS monitoring
- ARP monitoring
- SNMP monitoring
- Switch port monitoring
- FTP monitoring
- HTTP monitoring
- NetBios monitoring
- MAC address monitoring
- Service monitoring
- Process monitoring
- Folder existence monitoring
- File existence monitoring
- File size monitoring
- Disk space monitoring
- External application monitoring
- Java-Script monitoring
- Visual Basic Script monitoring
- MS SQL server monitoring
- MySQL server monitoring
- ODBC database server monitoring
- WMI monitoring
- SSH monitoring (Linux performance monitoring)
- Motherboard sensor (CPU and GPU temperature, fan speed, voltage) monitoring (Pro)
- S.M.A.R.T. HDD monitoring with SSD and NVMe support over network (Pro)
- Combined check (Common result of several checks)
- Expression check (Count formulas)
- Traffic usage and bandwidth monitoring using Netflow v5/9 (in Pro)
- Bandwidth monitoring using SNMP (in Pro)
- E-mail Monitoring (POP3)
- UPS monitoring over network and SNMP
- CCTV / IP camera / DVR / NVR monitoring
- OPC server monitoring (OPC DA)
- Modbus TCP monitoring (in Pro)
- MQTT monitoring (in Pro)
- RTSP video ctream bitrate monitoring (checking the camera picture quality / operation)
- REST API monitoring (for monitoring the 3rd party application results and parameters in JSON file)
- Wi-Fi signal strength monitoring (Wifi router, WLAN monitoring)
- QoS ICMP and UDP Monitoring (jitter, MOS, latency, R-factor)
- Linux Performance Metrics Monitoring
- Monitoring Server Hardware via IPMI
- Monitoring Changes to Switch Configuration Files