This feature is available in the PRO version only. The HDD, SSD, SATA, and NVMe drives are supported.
S.M.A.R.T. is a hard drive's built-in self-diagnostic system that measures and reports various parameters. It can also predict when the hard drive is going to fail. S.M.A.R.T. can monitor the HDD's temperature and other indicators, including some attributes that indicate its imminent failure. It should be noted that S.M.A.R.T. can predict mechanical failures, which account for about 60 percent of all HDD failures.
The Application automatically estimates the specified reliability parameters by comparing them with threshold values, and warns you if a hard drive failure is imminent. Moreover, the Application can estimate the overall condition of a hard drive based on a set of parameters. For this check to work, you need to install the Remote Agent on the target computer. Read more about the Remote Agents in the Installing and Configuring the Remote Agent section.
Adding the SMART check and selecting a HDD or SSD for monitoring
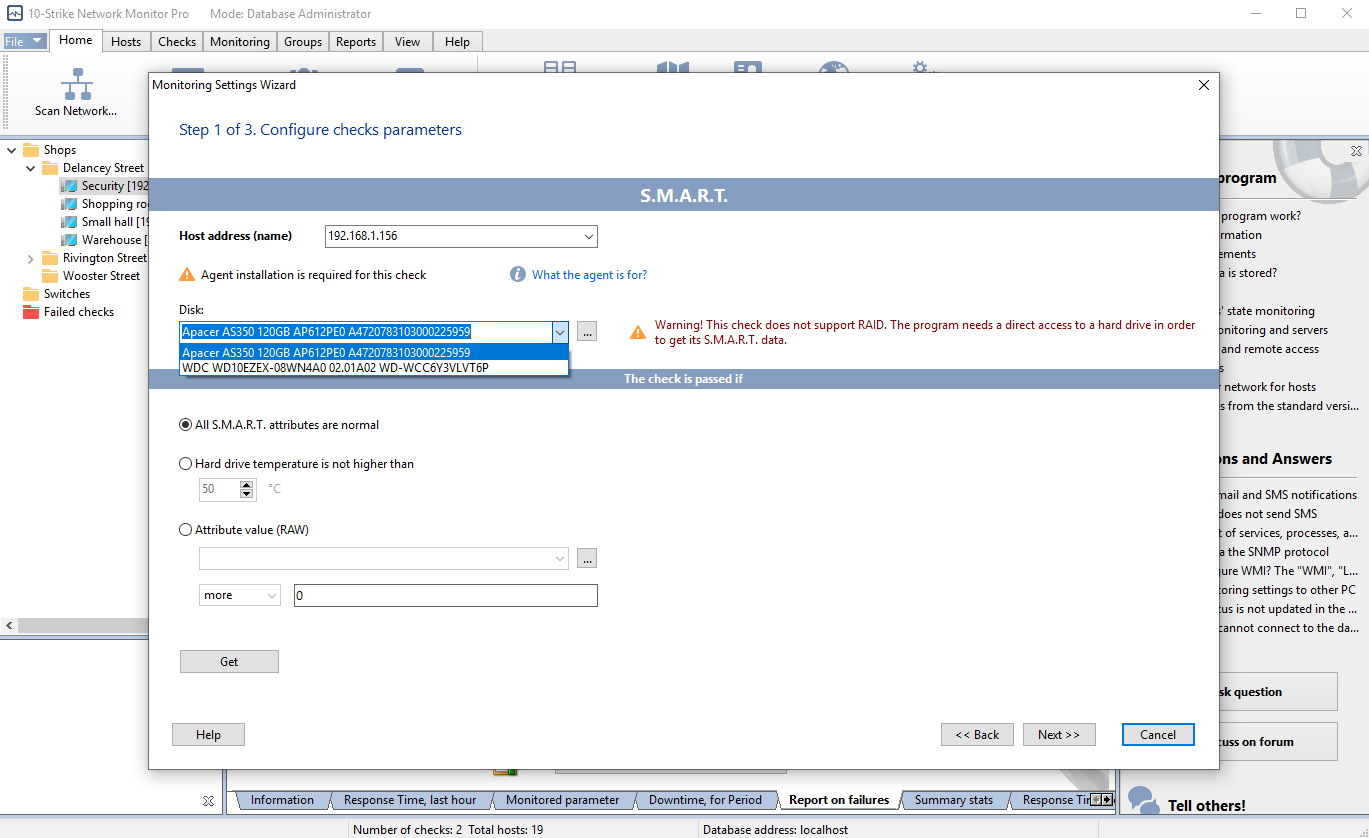
Configuring the SMART check and selecting parameters for monitoring
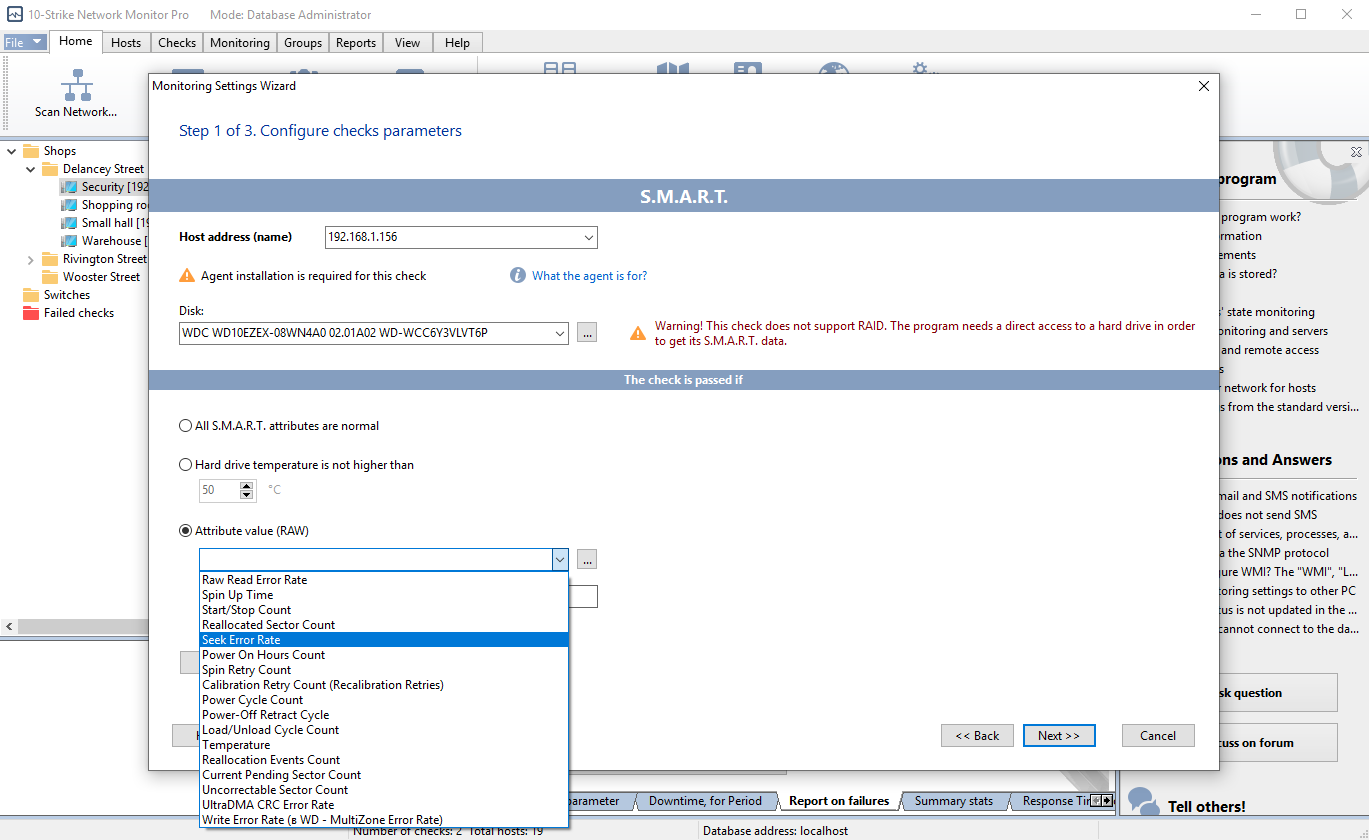
You can display the selected parameter value on a widget which will be added to the dashboard or placed on the graphic network map.
Solving the SMART Data Receiving Problem
If the program does not receive the S.M.A.R.T. data from one of your disks, or it is not listed at all, try switching the Agent to another mode. With this mode, the Agent will try to receive the S.M.A.R.T. data via the smartmontools utility. To enable this feature, open the NMAgent.ini Agent configuration file with any text editor and add the line:
GetSMARTMode=1
Example:
[AGENT]
TCPPort=45668
UsePasswd=0
Passwd=
UseIPFilter=0
IPList=
GetSMARTMode=1
Save the file and restart the 10-Strike Network Monitor Agent Service.
The NMAgent.ini file can be stored in the following folders:
- c:\Program Files (x86)\10-Strike Network Monitor Agent\ if the Agent was installed without the main program.
- c:\Program Files (x86)\10-Strike Network Monitor Pro\ if the Agent was installed together with the main program.
Monitoring S.M.A.R.T. Parameters for NVMe SSD Drives
The S.M.A.R.T. parameter set for NVMe SSD disks is different comparing with the ATA hard drive parameters. In most cases, this is a set of ready-made indicators, without specifying thresholds and worst-case values. Here's an example S.M.A.R.T. parameters for the M.2 SSD WD Blue SN500:
critical_warning: 0
temperature: 39
available_spare: 100
available_spare_threshold: 10
percentage_used: 1
data_units_read: 13733602
data_units_written: 14396473
host_reads: 365745477
host_writes: 391133456
controller_busy_time: 836
power_cycles: 1419
power_on_hours: 4612
unsafe_shutdowns: 13
media_errors: 0
num_err_log_entries: 1
warning_temp_time: 0
critical_comp_time: 0
Among these parameters, the most interesting are:
critical_warning
The parameter indicating the status of the disk:
- 0 - disk is fine
- 1 - disk resource is below threshold
- 2 - temperature has exceeded the threshold
- 4 - reliability decreases due to internal errors
- 8 - disk is in read-only mode
- 16 - volatile memory backup system error
temperature
Temperature in Celsius (sometimes it can be in Kelvin - you need to pay attention to this). Constant overheating of the SSD can lead to its rapid failure, therefore it is necessary to monitor this parameter.
percentage_used
Percentage of SSD resource consumed. As soon as this parameter reaches 100%, the SSD will go into read mode (locked). This is a very important parameter that needs monitoring. The task of the administrator is to track in advance those disks, the remaining resource of which is approaching the maximum value, and replace them.
media_errors
The number of times the controller encountered a fatal data integrity error. If the value of this parameter is constantly growing, you should consider replacing the SSD with a new one.
num_err_log_entries
The number of error log entries over the lifetime of the controller. As in the previous case, you should pay attention to the growth of this parameter.
SMART monitoring of older SATA SSDs
The health of pre-NVMe SSDs can also be monitored. Such disks can provide metric values such as "Total LBA Written Sectors" (Total LBA Written). This counter shows how many 512-byte sectors were written to the disk over the entire history of its operation. The options are:
241 - Total LBA Written (total written LBA) - the total number of 512-byte sectors, written over the entire life of the device.
or
175 - Host_Writes_MiB - how many MB were written to the disk.
You can find the threshold value for disk write volume over its lifespan (or endurance lifespan) in the documentation for the SSD on the manufacturer's website or in the instructions. It is usually measured in terabytes (TB) or recorded terabytes (TB Written or TBW). Typical values for modern drives range from 40 (for 5-10 year old models) to several hundred TB (for modern drives). When configuring the check, you need to specify the drive's maximum writing limit in TBs from the manufacturer's website. The program will read the current record size and compare with the maximum value, calculating the remaining lifespan.
With the help of our program, you can configure the monitoring of these parameters and set the critical values of the recording volume for the disk, after going beyond which, the program will notify you. You can also observe the current values of the recorded volumes as a percentage of the allowed maximum on rectangular indicators (widgets).
Learn more on HDD and SDD SMART monitoring over the network in our article...