The program can monitor MQTT parameters on various industrial machines and devices.
With the development of the Industrial Internet of Things (IIoT), there are more and more devices that interact with each other and need to be controlled and monitored. The Internet of Things is a large network of heterogeneous sensors, gauges, machines, devices that communicate with each other through various interfaces and data transfer protocols. One of the most popular communication protocols in such networks is MQTT or Message Queue Telemetry Transport. It is an open, lightweight and compact protocol designed to exchange data between devices located at a great distance from each other. MQTT was designed for networks with limited bandwidth. This feature has allowed it to be widely used in M2M (Machine-Machine Interaction) systems.
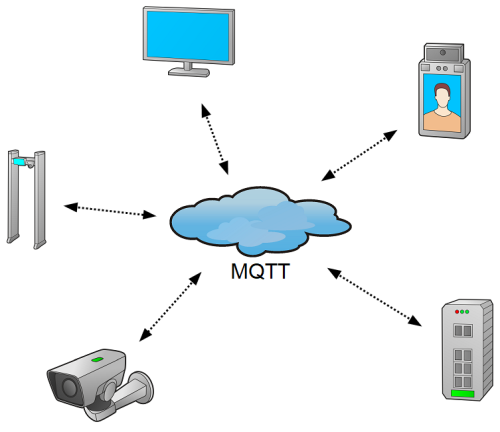
MQTT uses the TCP/IP protocol and port 1883 by default (8883 for SSL).
Advantages and Features of the MQTT Protocol
- Compactness of transmitted data
- Asynchrony
- Support for multiple levels of quality of service (QoS)
- Ability to work in conditions of intermittent communication, with unreliable channels
- Easy integration of new devices
There are three parties involved in message passing in MQTT:
- Publishers, message sources. These can be gauges, sensors and other IoT devices.
- Broker (MQTT-broker), the central MQTT node that provides communication between publishers and subscribers. The broker receives messages from publishers, processes them, passes them on to subscribers, and controls delivery. One of the popular, free brokers is Mosquitto MQTT.
- Subscribers, recipients of messages from devices (gauges and sensors). For example, monitoring software.
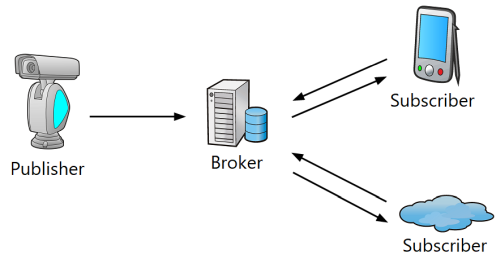
In a broader sense, the publisher and subscriber are a client which can perform both roles (publisher / subscriber) at the same time. An IoT device can be not only a publisher, but also a subscriber, receiving a configuration or the firmware update via MQTT.
A publisher sends data to the MQTT broker, indicating a specific topic (topic) in the message. Using the topic name, subscribers receive the data published by multiple publishers from the broker. Topic names consist of one or more levels, which are separated by the "/" symbol.
For example, this is how a topic can be called, in which the temperature sensor in the server rack publishes the data:
/data-center/servers-room-1/server-rack-2/temperature
The broker's response comes in the JSON format. For example,
{"d":{"id":"Dev1","W":90,34,"Q":1000,"S":2900}}
You can get the value of a desired variable when you know the format of the response:
/d/W/: 90,34
Data Protection
MQTT does not have its own mechanisms for protecting transmitted messages. For reliable protection in open networks, you should use the SSL plugin. However, MQTT still supports the simplest login and password authorization when connecting to a broker.
Application of the MQTT Protocol
MQTT is often used in industry to monitor equipment and read parameters from gauges and sensors. You can receive and analyze the data using the MQTT protocol in the 10-Strike Network Monitor Pro program. The configuration does not take much time - you just need to set the basic parameters:
- Broker IP address
- Port (1883, by default)
- Login and password
- Topic
- Path to the value of the variable if the response comes in the JSON format
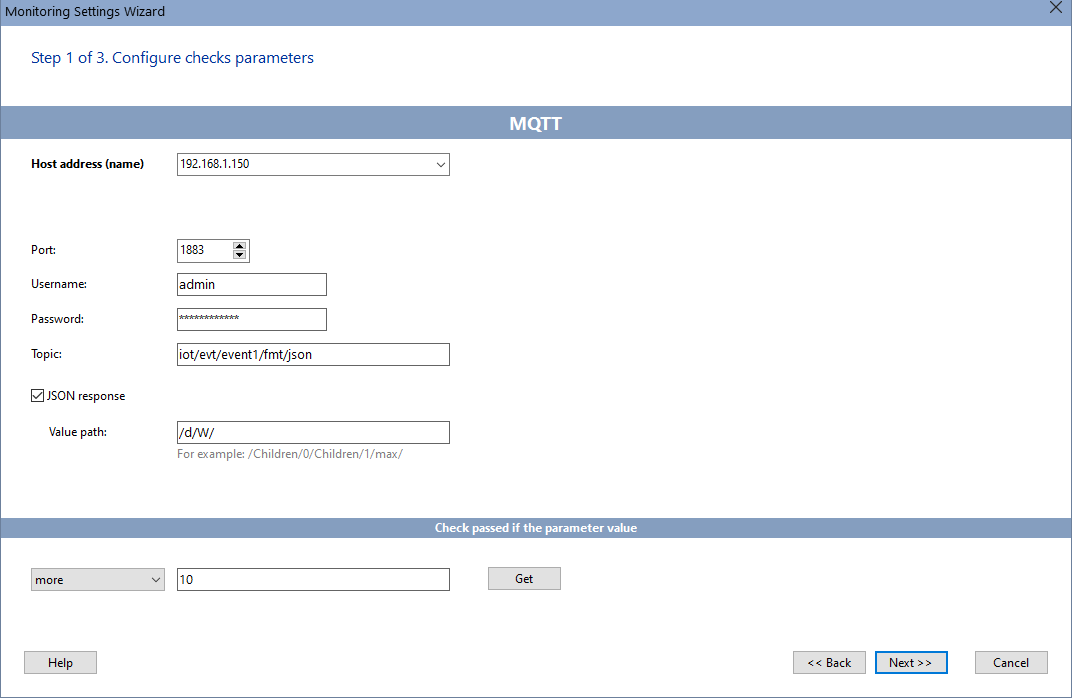
When the parameter value goes beyond the specified limits, the program promptly notifies about this in several ways. The alert threshold is set in the check parameters. The program acts as a subscriber, connects to the MQTT broker after a specified time interval, and requests the value published by the sensor in the specified topic.
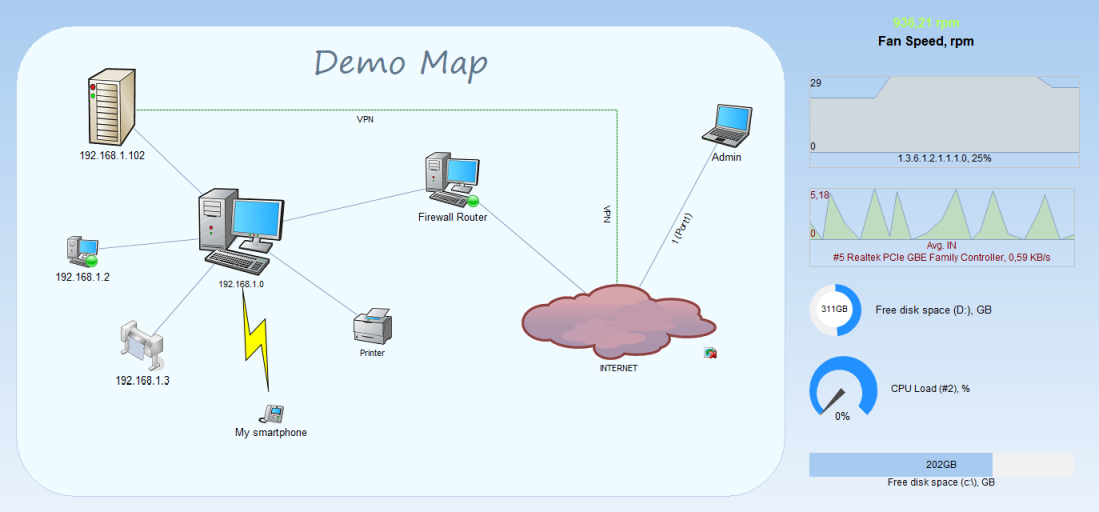
Smart sensors connected to the IIoT network monitor the operation of machine tools, transformers, wind turbines, cranes, and equipment racks. They transmit data to the central monitoring system where the data analysis is performed. Thanks to this, companies can monitor the operation of their equipment in real time, predict its degradation, and evaluate the efficiency of the enterprise.
You can display the monitored parameter values on graphic indicators or a SCADA-like scheme, diagram, or map.
Warning! This check is only available in the Pro version of the program.
See also:
Requirements: Windows XP/Vista/7/8.1/10/11, Server 2003/2008/2012/2016/2019/2022 supported.