In this article, we will tell you how to monitor the CPU temperature on remote servers and computers that run Windows. You can also monitor the GPU temperature and fan speeds over the network this way.
Article navigation:
- Why do you need to monitor CPU temperature and fan speeds
- Why do you need to monitor GPU temperature on a video card
- Utilities for local fan speed and temperature monitoring
- Centralized network monitoring of CPU temperature and fan speed on remote computers
- How to configure GPU and CPU temperature monitoring over the network
- Conclusion
- Download program for CPU/GPU temperature and fan speed monitoring
Why do you need to monitor CPU temperature and fan speeds
One of the critical parameters for the health of servers and workstations is the temperature of their main components, which are prone to overheating, especially in hot summer conditions, when performing complex calculations using the CPU and GPU, in games, cryptocurrency mining, in servers, etc. Hard drives, CPUs, video adapters - all of this is at risk from overheating, and the failure of anything from this list is guaranteed to lead to complete inoperability of the entire computer, and even loss of the user data. The best way to avoid this problem is to promptly eliminate the conditions that can lead to it: carry out preventive maintenance of technical equipment, replace worn-out elements of the cooling system or upgrade it, take care of effective air conditioning of the room, and so on.
Overheating does not occur suddenly and does not develop catastrophically within a short time, which means that it is possible to track the trend and take the necessary measures in time. So make sure that you monitor temperatures and fan speeds in computers. Thankfully, nowadays most motherboards have sensors for that purpose. The BIOS built-in hardware monitoring features are often useless. But you can easily find many good third-party applications to monitor CPU temperatures and fan speeds.
Why do you need to monitor GPU temperature on a video card
The GPU (graphics processing unit) temperature is an important indicator that needs to be monitored to ensure long and stable operation of the video card and computer. High temperatures can cause overheating and damage to GPU components, which can cause artifacts, application crashes, and even complete PC failure during mining, GPU-intensive computing, and gaming.
The GPU temperature monitoring allows you to:
Utilities for local fan speed and temperature monitoring
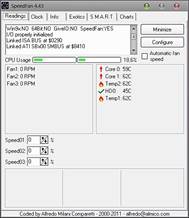
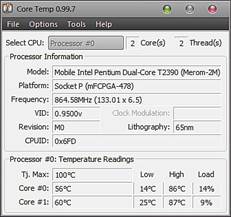
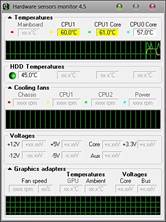
The most popular of them are probably SpeedFan, CoreTemp, Open Hardware Monitor, Hmonitor, and Real Temp.
The problem is, all of these apps are intended for the local computer, so you will have to instruct multiple users to check temperatures and fan speeds on a regular basis. In case of a server, you are out of luck, because you need to be logged in to use an app like that.
Centralized network monitoring of CPU temperature and fan speed on remote computers
But what if you need to implement centralized monitoring of all computers in your network, including automatic notifications in a critical situation? Actually, you can build an enterprise monitoring system based on the open-source software Zabbix and write scripts to parse Open Hardware Monitors console output. This approach can be useful if your company or organization already uses Zabbix and has a specialist who can configure it. But there is a much easier approach that allows you to save time and effort, and also doesnt require any special skills.
The 10-Strike Network Monitor Pro program can monitor the temperatures of CPUs, hard drives, and video adapters, as well as fan speeds and other parameters supported by the motherboard sensors. All you need to do is install the software on one of your servers, and also install Network Monitors agents on the computers that you want to monitor. After that, Network Monitor will scan the network, find any available hosts, and add them to the monitoring list. You need to create the check Temperature and other sensors for the computers on which Network Monitors agent is installed, and it will run at regular intervals. The monitoring core will analyze the values received from each agent and compare them with the threshold values. If the threshold is exceeded, Network Monitor can notify you about that by sending an SMS text message, email message, etc.
But it is not enough to be informed about something bad after the fact. It is much better to foresee a critical situation by analyzing accumulated data. 10-Strike Network Monitor Pro stores each received value in its database. It can plot graphs and generate reports based on collected data. Say, you can take a look at a fan speed graph, see that the RPM has been decreasing for the last few weeks (maybe due to bearing degradation), and replace the fan in good time. If the CPU fan speed is normal, but the CPU temperature has been slowly increasing for the last few weeks, its probably time to replace the CPU thermal grease.
How to configure GPU and CPU temperature monitoring over the network
It is easy to create a CPU temperature check in the network monitoring system. You need to do the following:
1) Install "10-Strike Network Monitor Pro"
2) Install Network Monitors agent on each host you want to monitor. The agent is a Windows service that will read the current temperature value and send it to the monitoring core.
3) Launch Network Monitor and run a network scan, or manually add the hosts.
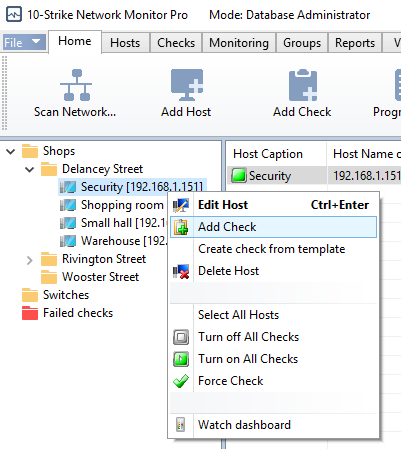
4) Select the host in the tree (at the left), and then select Add check in its context menu.
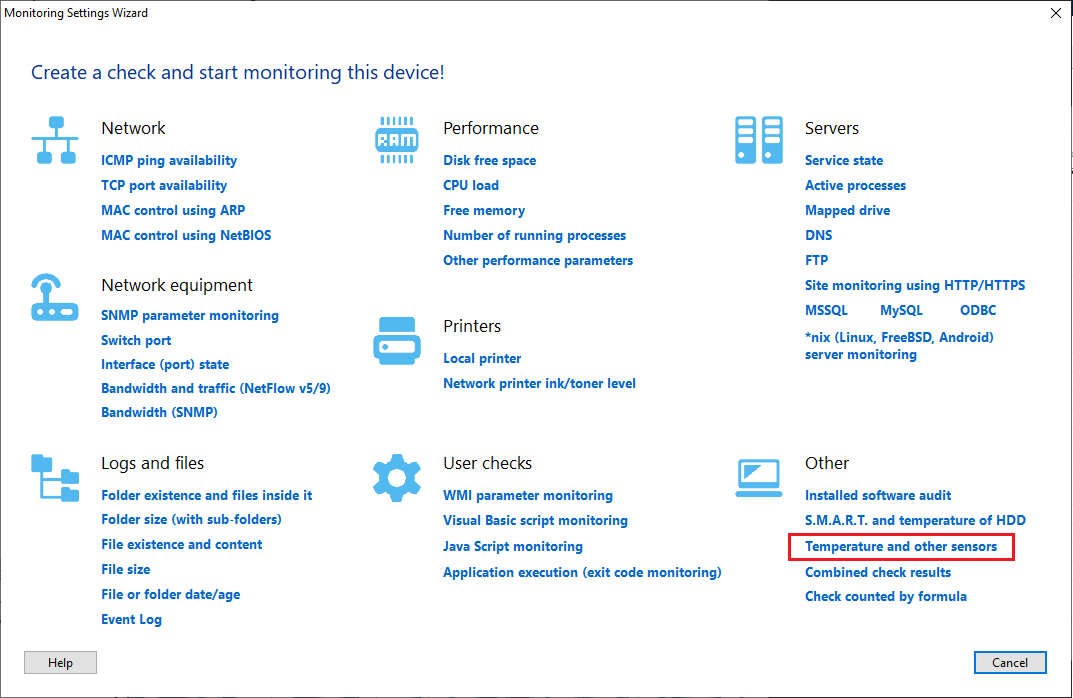
5) In the Check parameters dialog box, select the check type: Temperature and other sensors. After that, click the Get button (at the right, below the Motherboard sensors pane).
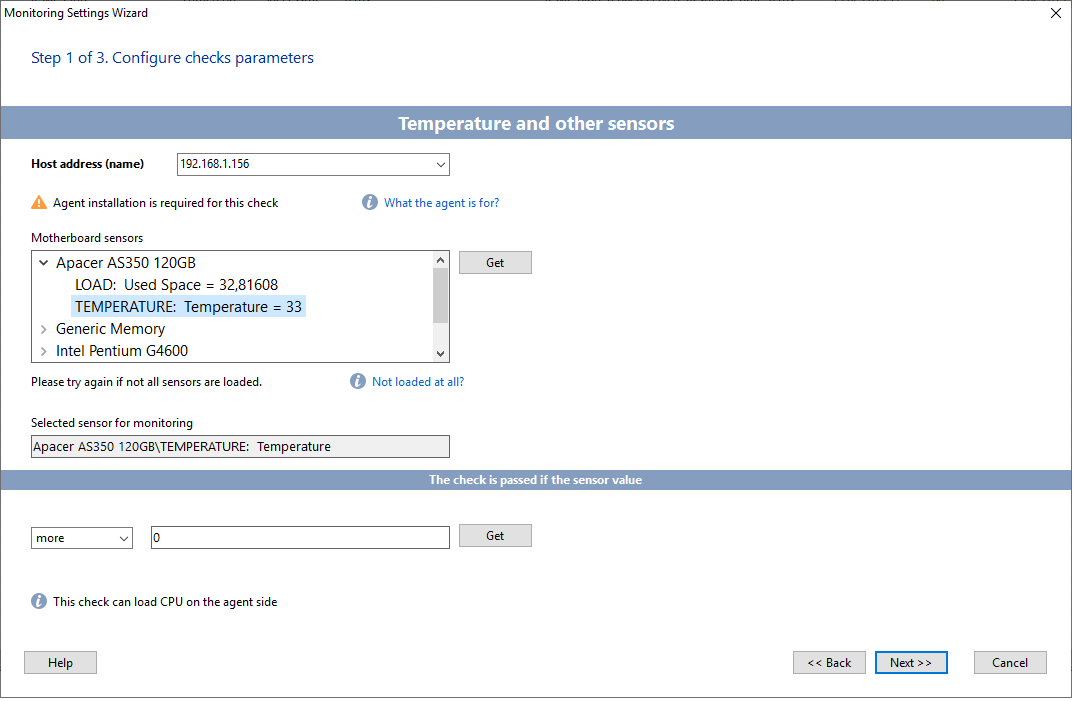
6) Find the name of the necessary equipment in the list of motherboard sensors and expand its node. In the list you will see the processor temperature, CPU core load, fan speeds, and GPU temperature. Select the desired parameter to monitor and set the alarm logic. For example, “the check is passed if the sensor value is less than 70” (for example, if we are talking about temperature in degrees Celsius). If the value is greater than 70, the check will be considered as failed and you can enable an alarm notification in further check properties. You can select any value suitable for the equipment (maximum temperature thresholds can be found in the documentation for the device).
When monitoring the fan speed, the current speed must be above a minimum threshold to be able to detect whether the fan is stopping or slowing down.
7) Go to the following steps: change the check execution parameters or leave them as they are. Set the alert parameters for generating alarms notifications if the check fails. And then save the changes.
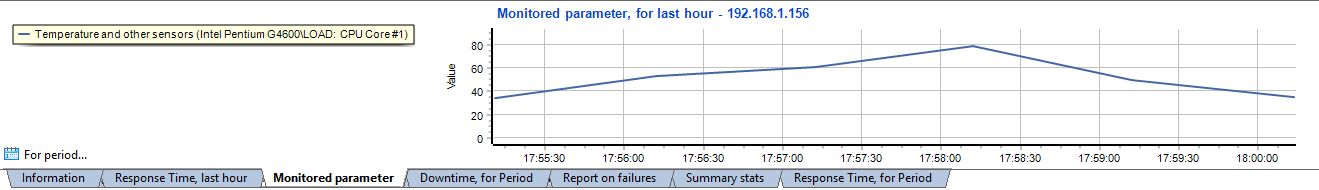
As soon as you add a new check, it will start collecting data. You can watch the data collection process by switching to the Monitored parameter tab (click the tab at the bottom of the window). Network Monitor will display a temperature graph.
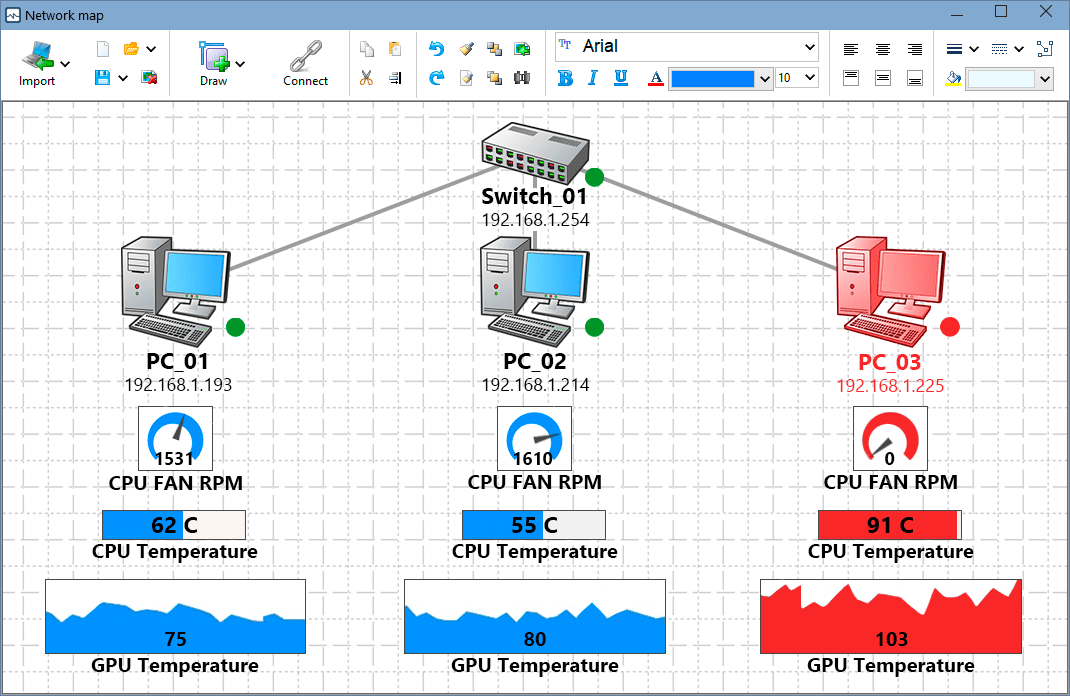
You can also add graphic widgets to the dashboard pane or to the network map in order to observe your computer park over the network this way...
Failed checks will be make the corresponding indicators and host icons red or yellow.
Conclusion
As you can see, it takes only 7 easy steps to implement a 24/7 monitoring of your servers and workstations critical health parameters, and it doesnt involve any highly technical, hard-to-understand methods.
10-Strike Network Monitor Pro allows you to build a distributed monitoring system. It means you can use it in a large company or organization that has multiple remote offices, each one with its own local network. The advantage of having a distributed system is that all the monitoring servers in remote networks will send the data theyve collected to the centralized database, and all the settings and check results will be stored in one place. Network administrators will probably love this solution, as they wont have to set up port tunneling on a remote networks router each time they need to configure monitoring for that network.