Bandwidth Monitor User Interface Description
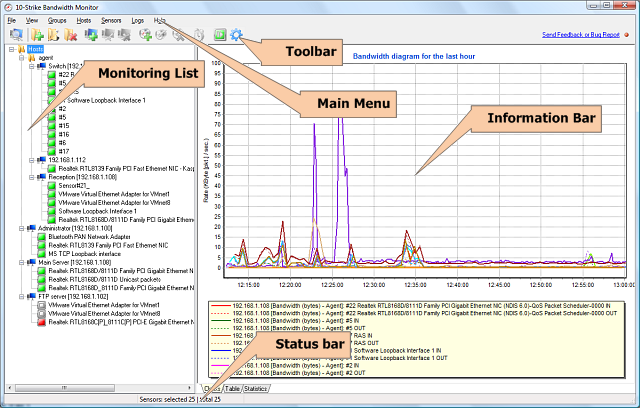
The main window of the program contains the main menu, the toolbar, the list of hosts and sensors, the navigation bar, the information bar, and the status bar.
Main menu
From the application main menu, you can call all functions available in the application.
![]() The File menu allows you to:
The File menu allows you to:
2. Connect to the server (the bandwidth monitoring service)
3. Start, stop, restart the monitoring service
4. Configure the application settings
5. Exit the application
![]() The View menu allows you to:
The View menu allows you to:
1. Show the bandwidth chart
2. Show traffic table
3. Show traffic, bandwidth, and downtime stats
4. Enable/disable the dark background on the diagram
5. Show/hide dates on the current diagram
![]() The Groups menu allows you to:
The Groups menu allows you to:
![]() The Hosts menu allows you to:
The Hosts menu allows you to:
![]() The Sensors menu allows you to:
The Sensors menu allows you to:
8. Force polling selected sensors
9. Update the list of sensors
![]() The Logs menu allows you to:
The Logs menu allows you to:
1. View the alert log
2. View the Windows Event Log
![]() The Help menu allows you to:
The Help menu allows you to:
1. Open this help file (contents)
2. View information about the application
3. Get other helpful information about the application
Toolbar
The toolbar contains buttons that provide quick access to the most frequently used functions of the application.
List of hosts and sensors to be monitored
The monitoring list contains hosts and sensors organized into groups (folders) in the tree-like form. You can configure any number of traffic sensors for each host. Select a specific host on the tree to show the sensors that belong to the host. When a group is selected, the sensor list displays all the sensors contained within this group of hosts.
Information bar
The Information bar shows all the available information about selected sensors on the tree.
On the Chart tab, the bandwidth speed chart is displayed.
One the Table tab, the sensor summary information is displayed:
- Host address which is monitored by the sensor
- Sensor name
- Physical (MAC) address of the monitored network interface
- Sensor type
- Current inbound traffic (volume, speed)
- Current outbound traffic (volume, speed)
- Date and time of the last update
- State (enabled/disabled)
- Status or the last error message
- Poll time interval
- Alert status
- Description
On the Stats tab, the sensor statistic information is displayed for a specified period of time (the Total sub-tab):
- Average speed of the inbound and outbound traffic
- Maximum speed of the inbound and outbound traffic
- Total volume of sent and received traffic
- Number of poll errors
- Total downtime
- Number of breaks occurred during the traffic monitoring (when the program was not running)
- Total file size of the statistics database
The Stats tab also contains the following sub-tabs: Speed, Volume, and Downtime Charts:
- Speed of the inbound and outbound traffic (bandwidth) for the specified period of time
- Traffic bandwidth (speed) and Volume by days of week
- Downtime for the sensor (or interface) for the specified period of time